
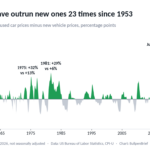


When used car prices take off, the usual question is how long it will last. We lined up the government’s price indexes for used and new cars month by month since December 1953 and found 23 separate stretches in which used car prices rose faster than new ones over 12 months. The median stretch lasted 17 months. The eight big ones, when used cars ran 10 points or more ahead, lasted a median of about 34 months, close to three years.
The last big run was the most extreme on record. In June 2021 used car prices were 45% higher than a year earlier while new vehicle prices were up 5%, a gap of 40 points. The previous record was 23 points, in August 1981. In September 2026, the latest data, used car prices were 1.5% lower than a year earlier and new ones 0.6% higher.
Key findings
- From December 1953 to September 2026, US used car prices rose faster than new vehicle prices over 12 months in 23 separate stretches (BLS CPI, runs of 3+ months); the median stretch lasted 17 months and the longest 56 months, April 1961 to November 1965.
- The eight runs in which used car prices got 10 points or more ahead of new ones lasted a median of about 34 months, against 12 months for the other 15 (BLS CPI, 1953 to 2026).
- Used car prices rose faster than new vehicle prices in 42 of 72 calendar years from 1954 to 2025 (58%, 95% interval 53% to 68%), and in 41 of 71 without 2021.
- In June 2021 US used car prices were 45.2% higher than a year earlier and new vehicles 5.3%, a 40-point gap, the widest since the used car index began in 1952; the previous record was 23 points in August 1981.
- In September 2026 the ratio of the used car to the new vehicle price index was 20% below its June 2021 peak and 9% above December 2019, so about three quarters of the pandemic jump had been given back; used car prices were 1.5% lower than a year earlier, new vehicles 0.6% higher.
- Caveat: the CPI tracks comparable cars, not average transaction prices, and adjusts new car prices for better equipment; the eight big runs are a small sample, and we found no reliable pattern in what follows a spike, so none of this is a forecast.
Used cars run ahead more often than not
The chart shows, for every month, how much faster or slower used car prices rose over the previous 12 months than new vehicle prices. Green is when used cars were pulling ahead.
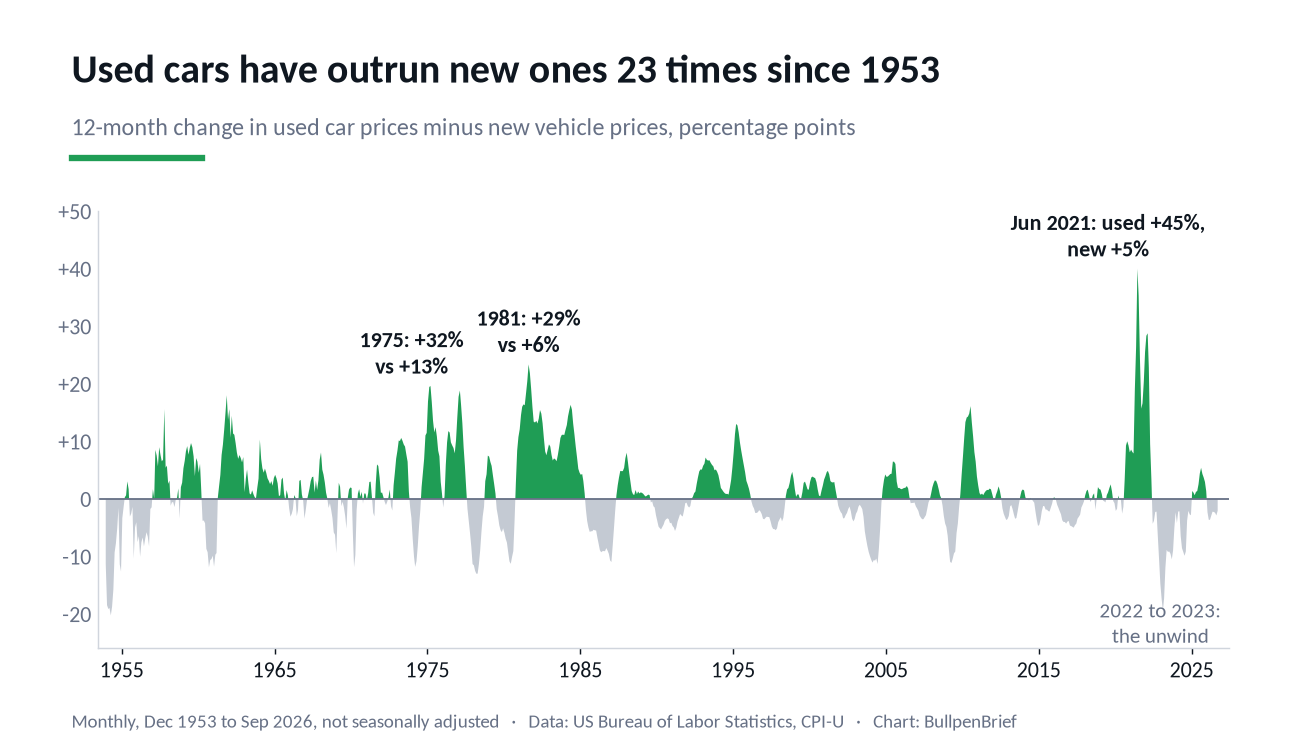
Measured over calendar years, December to December, used car prices rose faster than new ones in 42 of 72 years from 1954 to 2025, or 58%. Car prices move in multi-year cycles, so neighbouring years are not independent; with a bootstrap that resamples five-year blocks, the 95% interval for that share runs from 53% to 68%. By month, used cars were ahead 55% of the time.
Over the whole period the difference adds up. From December 1953 to September 2026 the used car index rose about 7.5 times and the new vehicle index about 3.9 times. Both rose far less than prices overall, which went up 12.5 times, largely because the indexes strip out the value of better equipment and safety features (more on that below).
The average yearly margin is less solid than the count. Used cars beat new ones by 1.2 points a year on average (interval 0.3 to 3.0), but 2021 alone, when used prices rose 37% and new ones 12%, accounts for 11% of the combined margin across all the years in which used cars came out ahead. Without 2021 the average falls to 0.9 points and the interval includes zero (minus 0.1 to 2.6). The count holds up either way: 41 of the remaining 71 years.
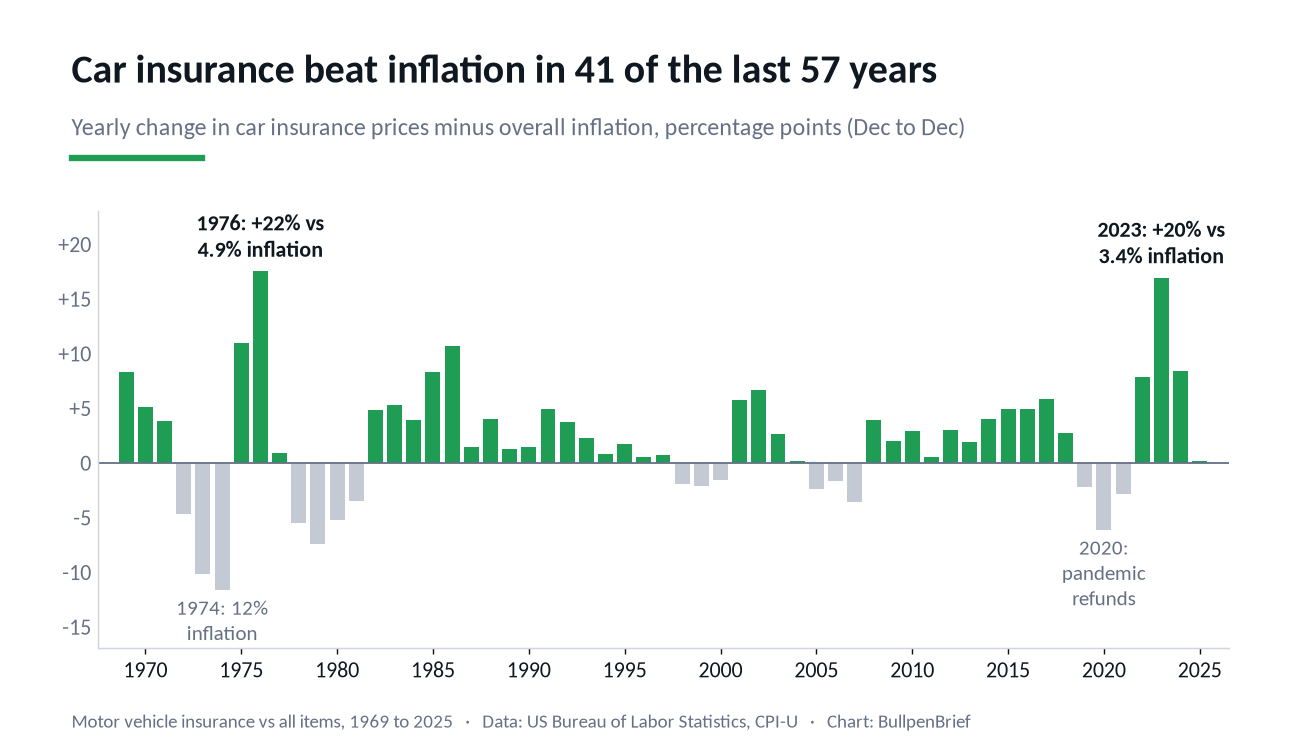
We looked at a related question earlier this month, how car insurance prices compare with inflation, where used and new cars appeared only as benchmarks. This study compares the two car markets with each other, month by month, and measures how long each run lasts and what follows.
How long a run lasts
We counted a run as any stretch of three months or more in which used car prices rose faster than new ones over 12 months, letting the run continue through dips of up to two months. By that rule there were 23 runs from 1953 to 2026, all of them over by now. The median lasted 17 months and the average 21.5; 70% lasted a year or more. The longest, 56 months, ran from April 1961 to November 1965; the next, 55 months, from October 1980 to April 1985.
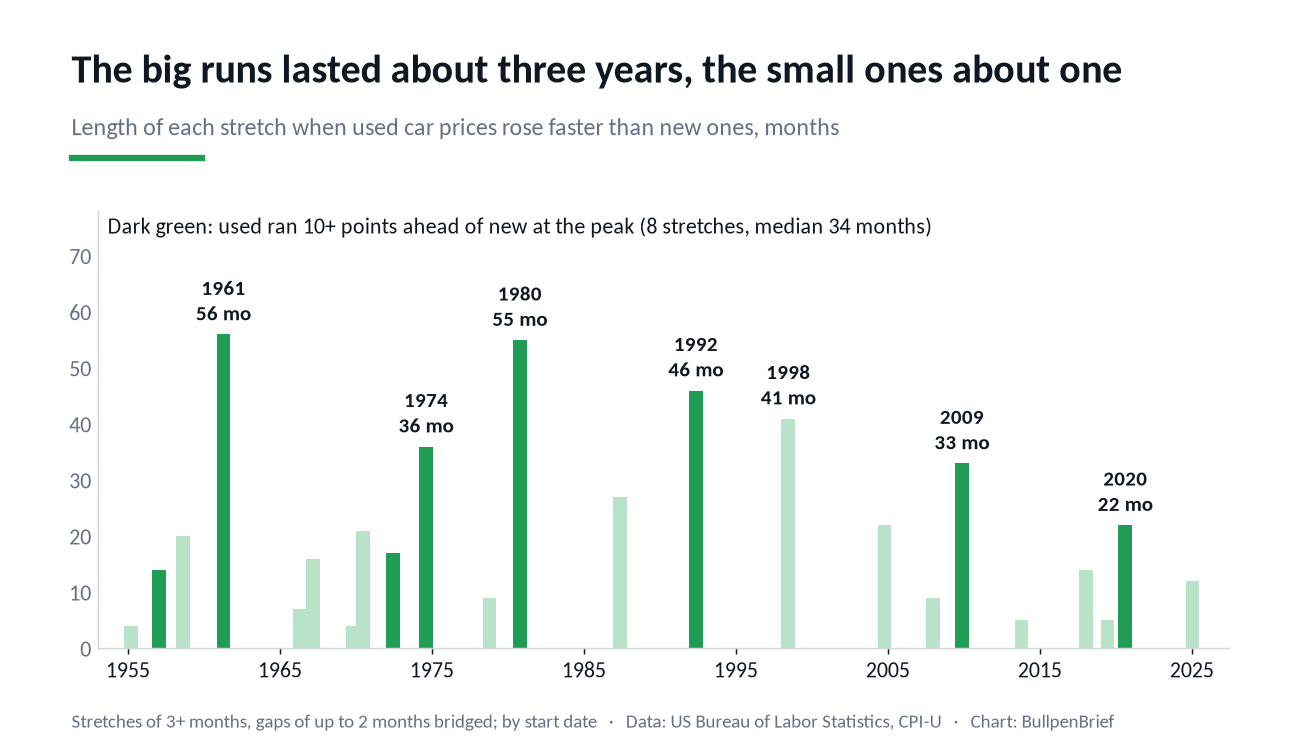
Size and length go together. The eight runs in which used cars got 10 points or more ahead at the peak (1957, 1961, 1972, 1974, 1980, 1992, 2009 and 2020) lasted a median of about 34 months. The other 15 lasted a median of 12. The 2020 run is the exception on length: the biggest gap on record, but over in 22 months, from August 2020 to May 2022.
The exact count depends on the rule, so we checked others. Counting every month-long blip gives 38 runs with a median of five months; requiring six months or more gives 19 runs with a median of 21 to 22 months. Whatever the rule, small runs last about a year and the big ones several years.
Several of the biggest runs share a backdrop. They began when new cars were scarce or hard to afford: the high inflation and interest rates of the mid-1970s and early 1980s, the recession and Cash for Clunkers scrappage program of 2009, and the chip shortage that cut new car production in 2021. Fewer new cars sold means fewer trade-ins a few years later, and more buyers turning to the used lot. We did not test these causes; the timing is what the data shows.
Do used cars give it back?
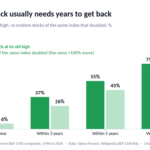
A common assumption is that a used car spike reverses quickly. The record does not show that. We took the ten times since 1953 when used cars first ran 10 points ahead of new ones over 12 months and followed the ratio of used to new prices from there. Twelve months later used cars had gained further on new ones in eight of the ten cases, with a median rise of 3.5%. After 24 months the median was still up 4.4%. Only after 36 months were more cases down than up, six of ten, with a median of minus 0.8%.
As a control we compared every month in which used cars were 10 points or more ahead (91 months) with all months since 1953. Over the following 12 months the ratio rose 2.0% on average after those months against 1.2% after any month; the difference, 0.8 points, has an interval of minus 3.4 to 4.1, so it is indistinguishable from zero. A regression of the ratio’s change over the next two years on its change over the past year gives a slope of minus 0.05 (interval minus 0.34 to 0.27): no sign that a strong year for used cars predicts a weak one.
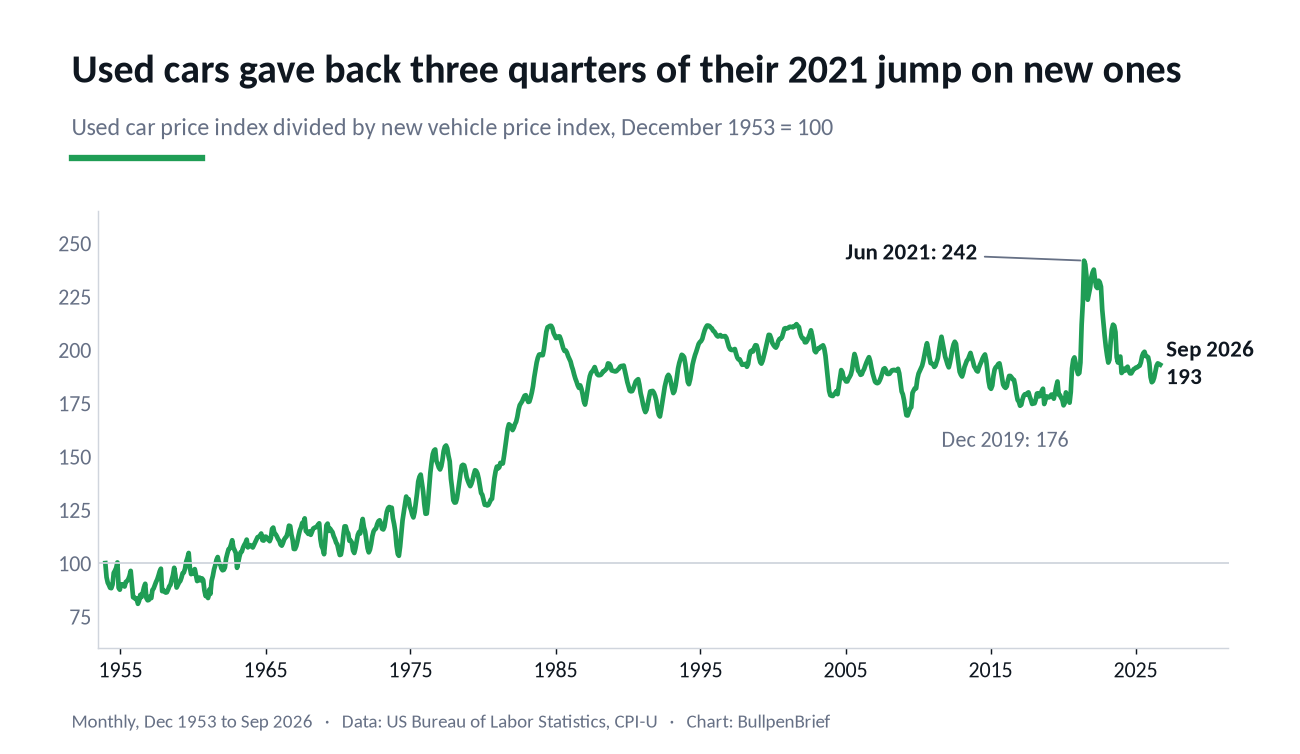
The 2020s wave did reverse, but slowly and only in part. Before the pandemic, in December 2019, the used to new ratio stood at 176 on our scale. It jumped to 242 in June 2021 and in September 2026 was at 193: 20% below the peak and 9% above where it started, so roughly three quarters of the jump has been given back over five years. In level terms, used car prices peaked in July 2022, 56% above December 2019, and are now 14% below that peak. Since December 2019 they are up 34.5%, new vehicles 23.0% and prices overall 31.1%.
The latest run was small. Used car prices rose faster than new ones through 2025, peaking in August at 6.0% against 0.7%, and the run ended in January 2026. Since then used prices have been lower than a year earlier every month.
What this is not
This is not a price guide for any one car. The Consumer Price Index tracks the price of comparable vehicles across the country. The used car index follows prices of cars of the same make, model and age over time, and the new vehicle index adjusts for better equipment: when a car gets a new safety feature, the index counts part of the higher sticker price as more car rather than a higher price. That is why both indexes rose far less than the average prices often quoted in the news, and less than prices overall.
It is also not a forecast. Runs ended for different reasons, and the sample of big runs is small, eight in 73 years. The ten 10-point spikes we follow overlap with each other in time and with the general business cycle, so we treat them as illustrations; the 91-month comparison with all months and the regression are the tests, and both found no reliable pattern either way.
And a lower used car index does not always mean used cars are a better deal. What buyers pay also depends on loan rates, which rose sharply from 2022, and on how many cars of a given age are available. We measured prices only.
Download the data (CSV)
used-vs-new-car-prices-1953-2026.csv: one row per month from December 1953 to September 2026 (874 rows). Columns: month, used cars and trucks index, new vehicles index, all items index, 12-month change in each, used minus new gap in percentage points, used to new ratio (December 1953 = 100), whether the month falls in a run of used cars outpacing new ones, and a flag for the six 1968 months we interpolated. Free to use and cite under CC BY 4.0 with attribution to BullpenBrief and a link to this page.
Methodology
All data come from the US Bureau of Labor Statistics Consumer Price Index for All Urban Consumers (CPI-U), US city average, not seasonally adjusted, downloaded through the BLS public API: used cars and trucks (series CUUR0000SETA02, from December 1952), new vehicles (CUUR0000SETA01) and all items (CUUR0000SA0). Twelve-month changes run from December 1953 to September 2026, the latest release, 874 months; yearly changes are December to December, 1954 to 2025, 72 years. In 1968 the used car index is missing six months, which we filled by geometric interpolation between neighbouring months (flagged in the CSV). The all items index has no October 2025 reading because of the federal government shutdown; the vehicle indexes do.
The gap is the 12-month change in used car prices minus that in new vehicle prices, in percentage points. A run is three or more months with a positive gap, with interruptions of up to two months bridged; a big run is one whose peak gap reached 10 points. A spike event is the first month the gap reached 10 points after at least 12 months below it (ten events). The used to new ratio is the used index divided by the new index, set to 100 in December 1953. Confidence intervals are 95% moving-block bootstrap intervals, with five-year blocks for yearly data and 36-month blocks for monthly data, because overlapping 12-month changes are strongly correlated. Figures, charts and the method are free to cite with attribution to BullpenBrief.