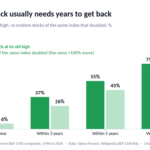



“It will come back” is the most common thing said about a stock that has lost half its value. We checked how often it does. Since 1996, stocks in today’s S&P 1500 closed at half their previous high 2,691 times, at 1,350 different companies. Only 11.5% of those halvings were back at the old high within a year. Within five years, 55% were. For the ones that made it, the median wait was 3.3 years.
And those are the good numbers. Every company in this count is still trading and still big enough to be in an S&P index today. The ones that went bankrupt or were bought out cheaply after halving are not here, so the real odds of getting back are lower.
Key findings
- Of 2,576 cases since 1996 in which a stock now in the S&P 1500 closed at half its previous high, 11.5% were back at that high within one year (95% interval 4.8% to 20.8%), 36.6% within three years and 55.2% within five years (2,134 cases; Yahoo Finance prices, split-adjusted, without dividends).
- Halved S&P 1500 stocks that did get back to their old high needed a median 3.3 years (1,207 days) from the halving, and 37% of halvings at least five years old fell to 75% below the peak first or have not recovered (2,134 cases, 1996 to 2021).
- A halved S&P 1500 stock regained its high, a +100% move, more often than random stocks of the same index doubled from the same day, 55% against 45% within five years (difference 5.4 to 14.0 points), but within ten years the gap, 75% against 70%, is not distinguishable from zero.
- When a stock halved while the S&P 500 was within 10% of its own high, 47.5% fell to 75% below their peak within five years, against 22.5% of stocks that halved during a 20%+ market decline (difference 11 to 40 points; 765 and 873 halvings, 1996 to 2021).
- 47 current S&P 500 members halved from their peak after January 1, 2025 and had not regained it as of October 13, 2026, including UnitedHealth, Oracle, Salesforce, ServiceNow and Intuit.
- Caveat: only companies still in the S&P 1500 today plus 19 former S&P 500 members that still trade are counted, so bankruptcies and cheap buyouts are missing and every recovery rate is a ceiling; the former S&P 500 members got back within five years in 6 of 17 cases.
Getting back takes years, not months
A stock at half its high needs to double to get back, a 100% gain. We tracked every halving to the first day the price was back at its old peak, and compared it with random stocks from the same index on the same day that made the same +100% move.
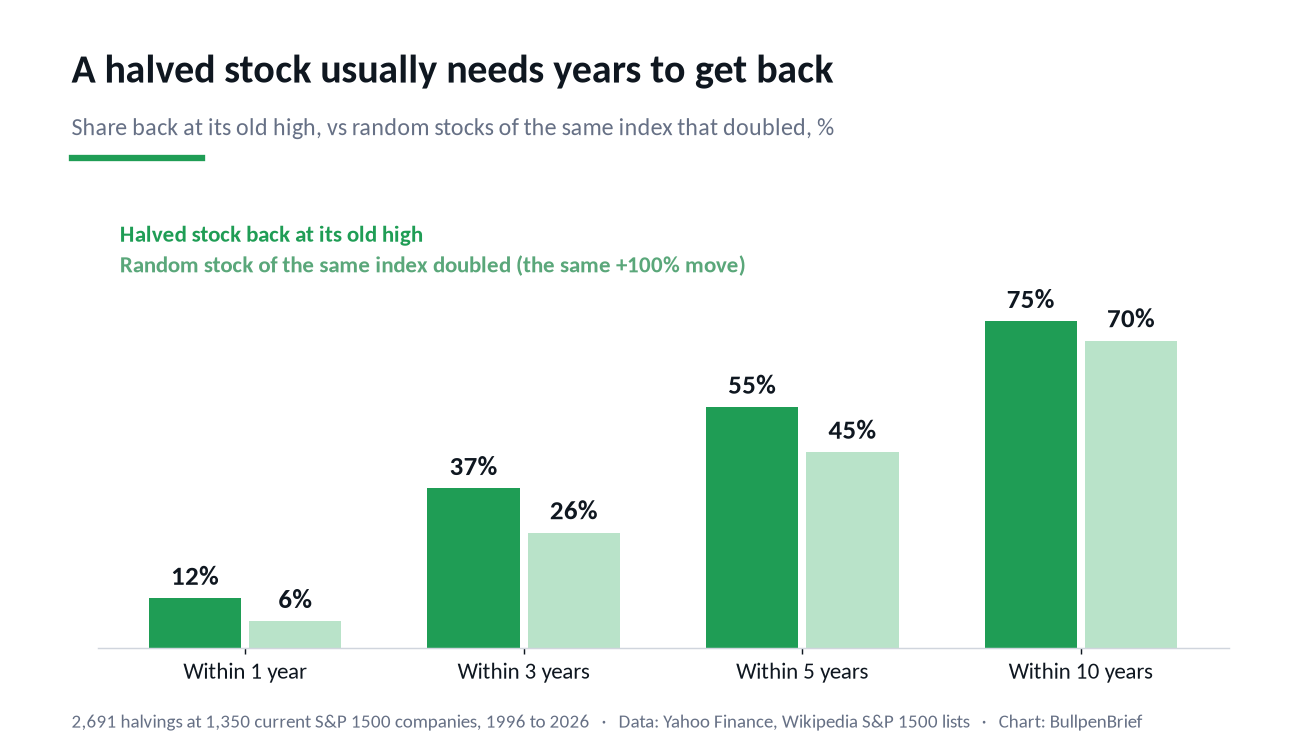
Within one year, 11.5% of halved stocks were back at the high (95% interval 4.8% to 20.8%, 2,576 halvings at least a year old). Within three years, 36.6% (29.9% to 45.6%). Within five, 55.2% (48.1% to 62.9%, 2,134 halvings). Within ten, 74.8% (66.8% to 80.5%, 1,624). A quarter of the survivors were still below their old high a decade later.
The halved stocks did get their +100% slightly more often than ordinary stocks doubled: 55% against 45% within five years, a gap of 5.4 to 14.0 points. That is not a sign of hidden value. Stocks that halve are more volatile than average, and volatile stocks make big moves in both directions more often. By ten years the gap, 75% against 70%, is within the noise.
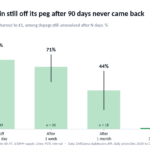
The path back is rarely straight. Of the 2,134 halvings at least five years old, 72% fell to 60% below the peak before they recovered or by today, 37% fell to 75% below it, and 15% to 90% below it. For more than a third, the day the stock was down 50% was not the bottom, it was halfway down.
A stock that halves on its own is the riskier kind
A stock can halve because the whole market is crashing, as in 2008 or March 2020, or because something went wrong at the company while the market was fine. We split the halvings by where the S&P 500 stood that day.
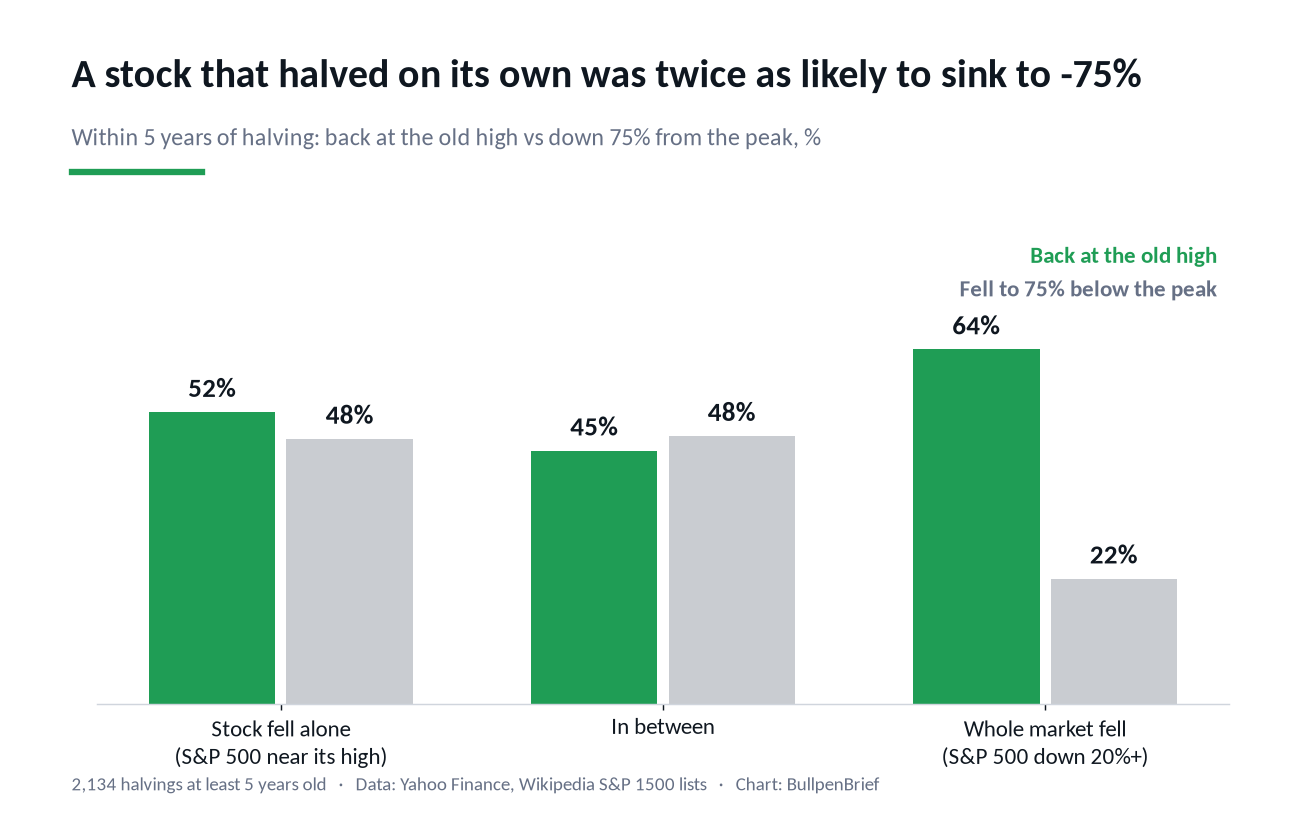
When the S&P 500 was within 10% of its own high, the stock had fallen alone. Of those 765 halvings, 47.5% went on to fall 75% below the peak within five years, and 52.3% were back at the high. When the S&P 500 was down 20% or more, the stock had fallen with everything else. Of those 873 halvings, only 22.5% sank to 75% below the peak, and 63.5% were back within five years. The difference in further losses, 25 points, has a 95% interval of 11 to 40 points. The difference in recovery, 11 points, is not distinguishable from zero with this data.
Size did not change much. Within five years, 57.5% of halvings at current S&P 500 companies were back at the high, 57.8% at S&P 400 companies and 52.3% at S&P 600 companies. Neither did history: a stock’s first halving in our data recovered within five years 54.3% of the time, a later one 56.4%. Leaving out the crash years 2000 to 2002, 2008, 2009 and 2020, the five-year rate is 52.2% (44.6% to 58.2%).
Even famous winners waited a long time
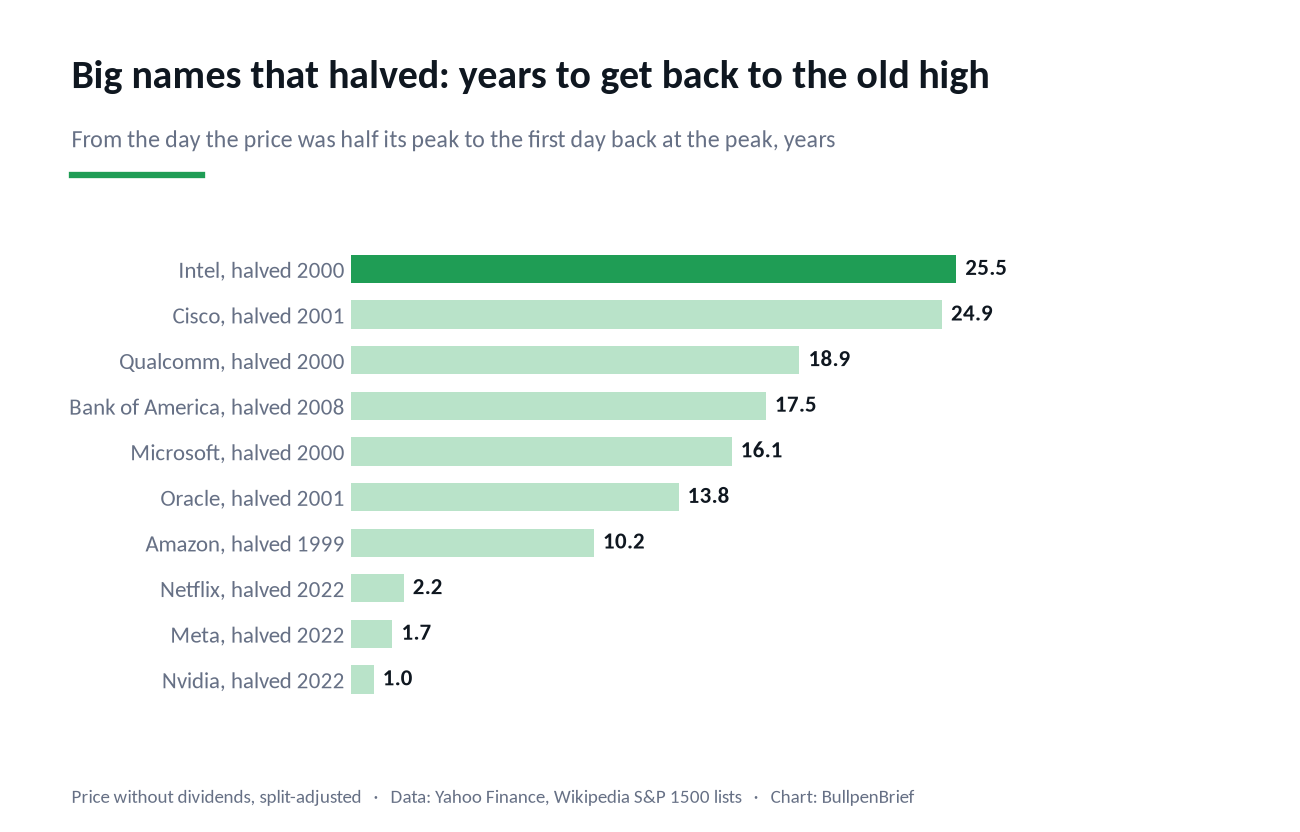
The 2000 tech bust is the extreme case. Microsoft halved in October 2000 and needed 16.1 years to get back to its 1999 high. Cisco needed 24.9 years and only passed its March 2000 close in December 2025. Intel needed 25.5 years and passed its August 2000 high in April 2026. Amazon took 10.2 years from its first halving in 1999. All of these are price-only figures, without dividends.
The 2022 bear market went much faster for the biggest names: Nvidia was back at its high in under a year, Meta in 1.7 years and Netflix in 2.2 years. Those three are the kind of stories people remember, and the reason “it always comes back” sounds right. Across all halvings, the typical recovery took more than three years, and one in four survivors had not made it after ten.
Who is halved right now
As of October 13, 2026, 679 halvings in our data had not yet been followed by a return to the old high. 173 of them started in 2025 or 2026. Among current S&P 500 members, 47 have halved since January 2025 and are still below their peak, including UnitedHealth, Oracle, Salesforce, ServiceNow, Intuit, Accenture, Fair Isaac, Chipotle, Coinbase and Robinhood. Based on the history above, roughly one in ten such stocks gets back to the high within a year of halving and about half within five years, and that is before counting the ones that drop out of the index along the way.
What this is not
This is not a finding that halved stocks are bargains. Over five years the halved stocks in our data did beat the S&P 500 by a median 28.6 points, against 7.3 points for random stocks of the same index, but that comparison is the one most distorted by survivorship: a company that halved and then failed is exactly the kind that is no longer in the S&P 1500 for us to count. We do not report it as an edge.
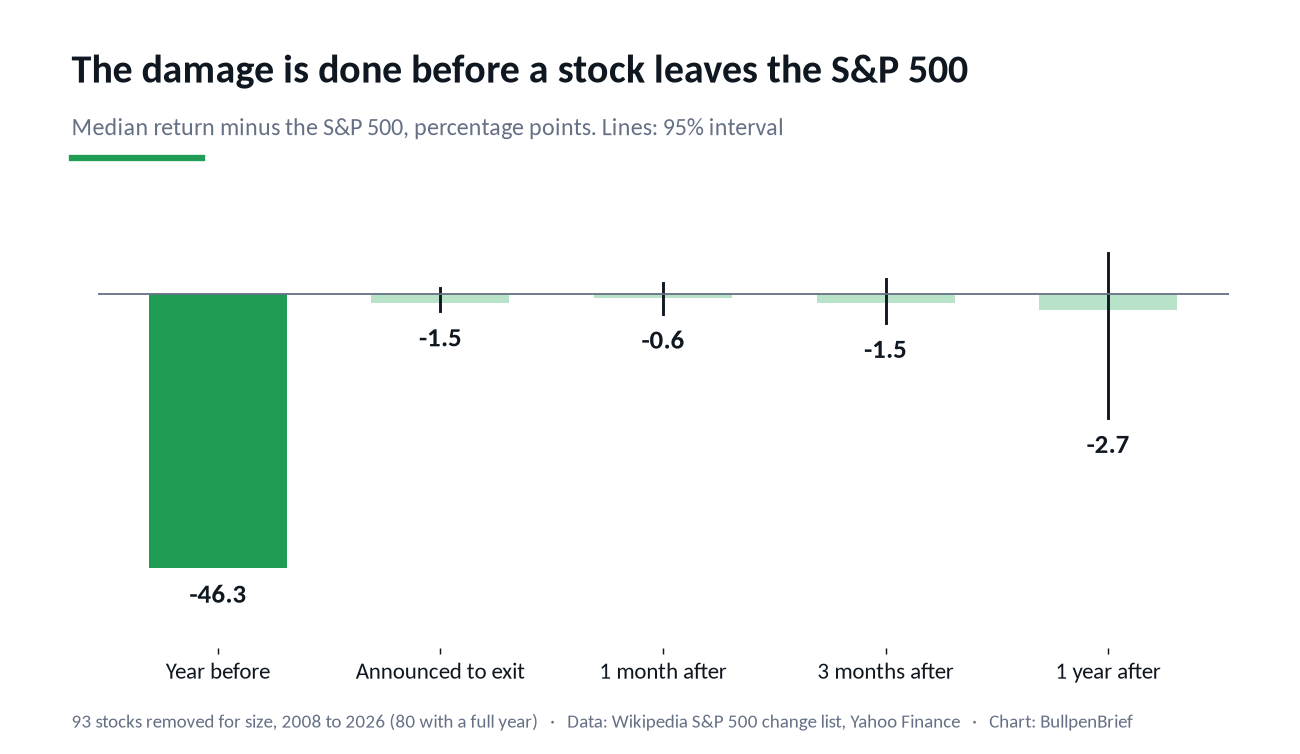
The survivorship problem is real and we cannot fully fix it. Yahoo Finance keeps no price history for most delisted companies, so we could only add 19 former S&P 500 members that still trade. Their halvings recovered within five years in 6 of 17 cases, 35%, against 55% overall. In our earlier study, stocks removed from the S&P 500 had typically trailed the index by 46 points in the year before they left. Treat every recovery rate here as a ceiling.
It is also not about dividends. We measure the price that shows on a chart. A stock that pays a dividend gets its holders back to even sooner than its price does. And the “high” is the highest point since January 1995 or since the stock started trading, so for older companies an earlier peak may be higher still.
Download the data (CSV)
halved-stocks-recovery-1996-2026.csv: one row per halving: a day when a stock now in the S&P 1500 (or a former S&P 500 member that still trades) first closed at half its previous high, January 1996 to October 2026 (2,691 rows). Columns: halving date, ticker, company, GICS sector, index group, peak date and price, price at halving, days from peak to halving, how far the S&P 500 was below its own high, date and days to get back to the peak, deepest fall from the peak before recovery or to date, back within 1, 3, 5 and 10 years, fell 75% within 5 years, and 5-year total return minus SPY. Free to use and cite under CC BY 4.0 with attribution to BullpenBrief and a link to this page.
Methodology
The universe is the current S&P 500, S&P 400 and S&P 600 from Wikipedia’s constituent lists (1,500 companies), plus 19 companies removed from the S&P 500 since 2007 that still trade and are not in the S&P 1500 today, from Wikipedia’s S&P 500 change table. Daily closing prices adjusted for splits but not dividends come from Yahoo Finance, from January 1995 to October 13, 2026; 1,510 companies had prices.
To avoid single bad ticks, we use the median of the last five closes. A halving is the first day this price is 50% or more below its highest level so far, after at least 252 trading days of history. The stock is then back at its high on the first day the same price reaches that peak again. A new halving for the same stock can only start after it has recovered and halved again from a new peak. We dropped 49 halvings at a price under $1, and 12 where the drop came in one day and the dividend-adjusted price barely moved that day, which means a spin-off or a large special dividend rather than a real loss (Altria in 2008 after the Philip Morris International spin-off, for example). That leaves 2,691 halvings. A halving counts for a horizon only if that much time has passed by October 13, 2026.
The control group is five random stocks from the same index group on the same day, each with at least a year of history, a price of $1 or more and not itself at half its high; the outcome is whether its price doubled within the same horizon, 13,475 control draws in total. Market conditions use the S&P 500 ETF (SPY) closing price against its own high. Confidence intervals are 95% bootstrap intervals that resample whole calendar years of halvings, because halvings come in waves (2000 to 2002, 2008, 2020, 2022) and are not independent. Figures, charts and the method are free to cite with attribution to BullpenBrief.