


When a company director or officer buys their own stock with their own money, it is one of the most quoted signals in investing. We tested it on 34,652 open-market purchases reported to the SEC since 2016. The first result is blunt: 58% of the stocks insiders bought went on to trail the S&P 500 over the next six months, and the median one lagged by 5.6 percentage points.
That number is less damning than it sounds, because insiders mostly buy small companies, and small companies have trailed the index for a decade whether anyone buys them or not. Once we compared like with like, a real but small edge appeared. Most of it comes from when insiders buy, not what they buy.
Key findings
- In 58% of 34,652 open-market purchases of at least $25,000 by US company directors and officers (SEC Form 4, January 2016 to June 2026), the stock trailed the S&P 500 over the next six months; the median one lagged by 5.6 percentage points.
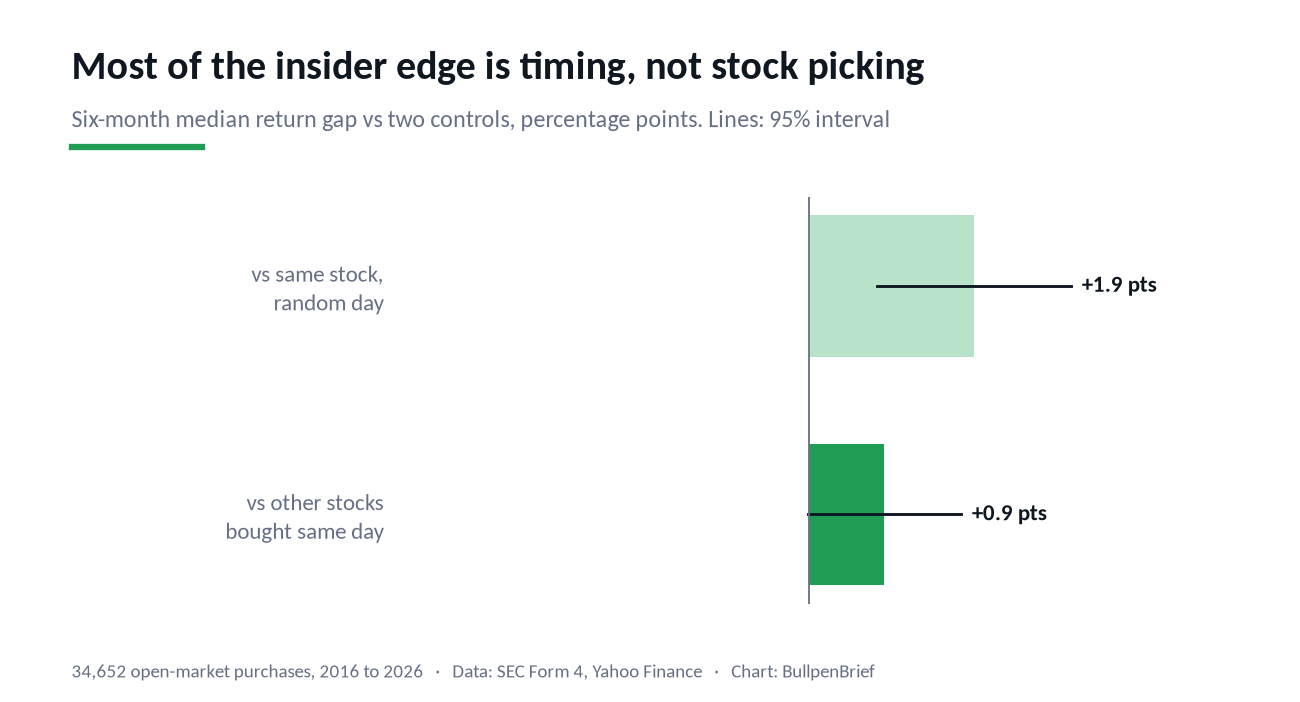
- Against the same stocks on random days, insider-bought stocks did 1.9 points better over six months (median, 95% interval 0.8 to 3.1; 34,652 purchases, 2016 to 2026); over 30 and 90 days the gap was indistinguishable from zero.
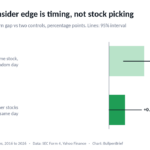
- Against other stocks bought on the same day, the six-month edge of insider purchases shrinks to 0.9 points (interval -0.01 to 1.8), and without 2016 and 2020, two post-selloff years, it is -0.2 points: most of the edge is timing.
- Smaller insider buys did better: purchases of $25,000 to $100,000 beat same-day stocks by 1.4 points over six months, purchases above $2 million lagged by 2.4 points, and CFO purchases led by role at +2.0 points (SEC Form 4, 2016 to 2026).
- Caveat: 17,820 purchases in tickers without Yahoo Finance price history (delisted or renamed companies) were dropped, and all figures are medians before trading costs.
Against the stock’s own history: a modest edge, and only after six months
The first fair comparison is the same stock on a random day with no insider buying within 180 days either side. Against that baseline, stocks bought by insiders did 1.9 points better over six months (median, 95% interval 0.8 to 3.1 points). Over 30 days the gap was 0.1 points and over 90 days 0.0, both indistinguishable from zero. Whatever insiders know, the market does not price it in the weeks after the filing, and it does not show up in the first quarter either.
Against other stocks bought the same day: most of the edge disappears
The second comparison asks a harder question. If you had bought three random stocks from the same universe on the same day the insider’s filing became public, how would you have done? Against that baseline the six-month edge shrinks to 0.9 points, with a 95% interval from minus 0.01 to 1.8 points, which just touches zero. That is at the edge of what can be told apart from noise.
The difference between the two comparisons is timing. Insider buying bunches up after selloffs (2020 has more insider purchase filings than any other year since 2016), when their own share price is down and so is everything else of similar size. In 2020, purchases filed during and after the March crash beat same-day stocks by 6.8 points over six months; in 2016, after the winter selloff, by 4.8 points. Take those two years out and the edge against same-day stocks is minus 0.2 points (interval minus 1.1 to 0.8). In the remaining years, the stocks insiders chose did no better than the stocks they did not.
The hit rate tells the same story. Over six months, 42.0% of insider buys beat the S&P 500. So did 40.1% of random stocks bought on the same days, and 38.7% of the same stocks bought on random days.
Where a small edge survives: modest buys by CFOs and directors
Splitting the purchases up shows that the folk version of the signal gets the details backwards.
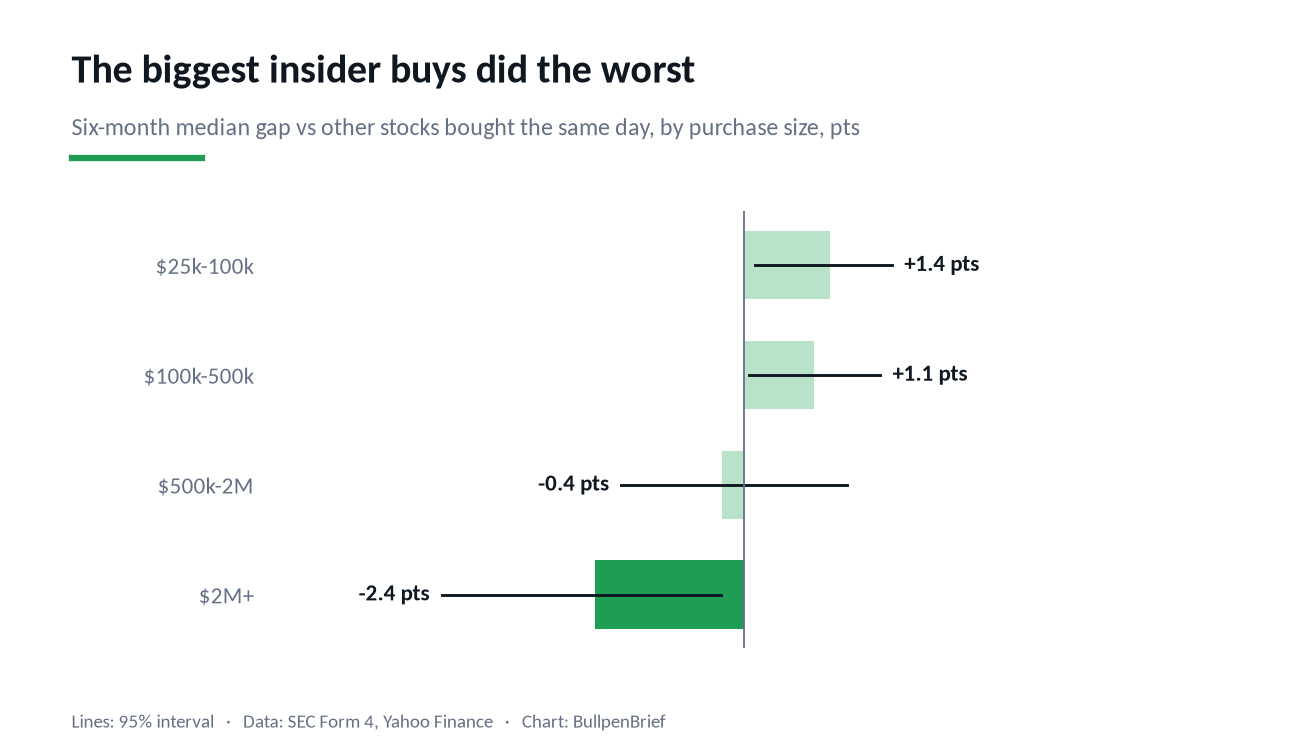
Bigger was worse. Purchases of $25,000 to $100,000 beat same-day stocks by 1.4 points over six months (interval 0.2 to 2.4). Purchases above $2 million lagged them by 2.4 points (interval minus 4.9 to minus 0.4). One plausible reason, which our data cannot test: very large buys are more often made to steady a falling share price or to signal confidence, and a signal sent on purpose is a weaker signal.
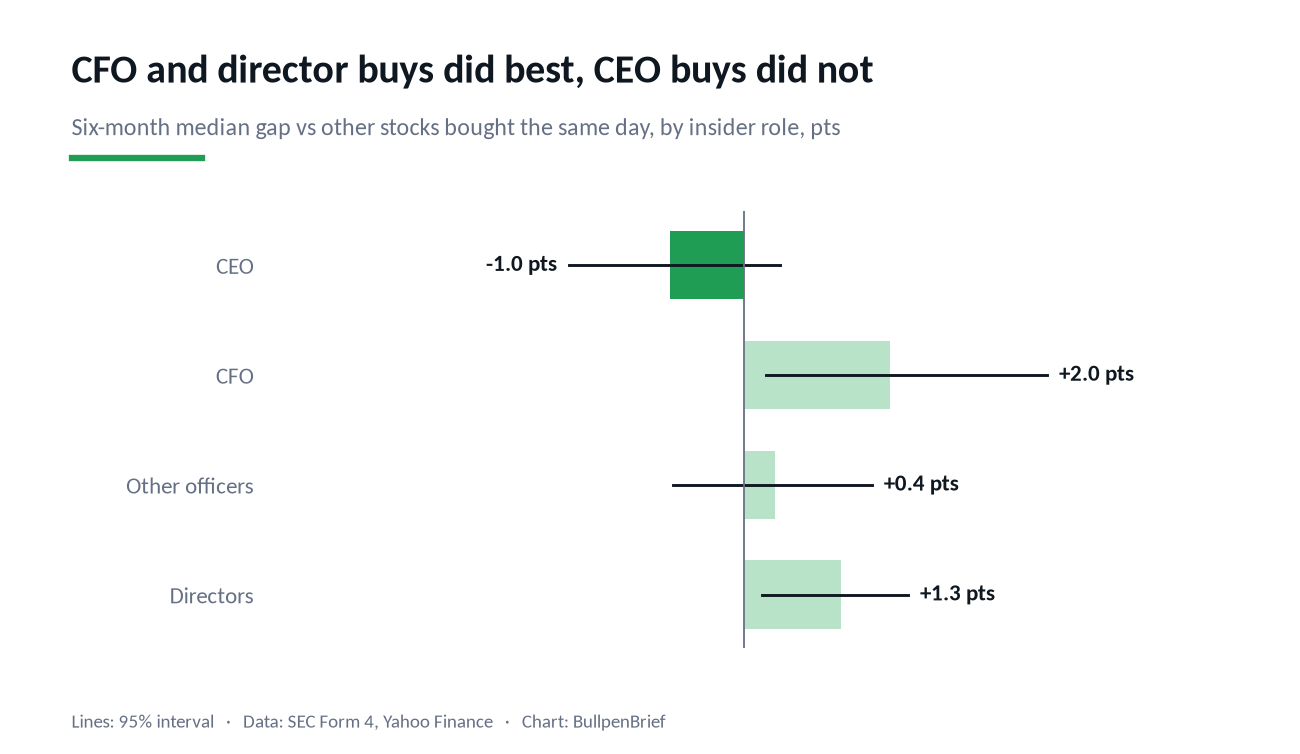
CFOs and directors did better than CEOs. CFO purchases beat same-day stocks by 2.0 points (interval 0.3 to 4.2) and directors by 1.3 points (0.2 to 2.3). CEO purchases came in 1.0 point behind, with an interval from minus 2.4 to 0.5 that does not rule out zero. Our guess, not a finding: the CEO is the most visible buyer and the one most likely to be buying partly for the audience.
Clusters did not help. Many screeners highlight stocks where three or more insiders buy within a month. In our data those purchases beat same-day stocks by 0.3 points, an interval from minus 1.5 to 2.0, against 1.2 points (0.3 to 2.1) for an insider buying alone.
What this is not
This is not a finding that insider buying is useless. Against the stock’s own history the edge is real, and it is consistent with academic work that finds insiders time their purchases well. What our numbers say is that most of that timing is visible without reading Form 4: insiders buy when small stocks are cheap after a selloff, and so could anyone.
It is also not a trading strategy. The figures are medians, before trading costs, and small-company spreads alone can consume a one-point edge. The averages are higher than the medians (insider buys averaged plus 1.2 points against the S&P 500 over six months, the same stocks on random days minus 3.1) because a few stocks multiplied. The largest single gain, GeneDx after a November 2023 director purchase, was 2,273%, but it accounts for 0.4% of all gains in the sample and dropping the ten largest moves the average only from 1.2 to 0.8.
The main weakness is survivorship. Yahoo Finance keeps no price history for many delisted and renamed companies, so 17,820 purchases in 2,654 tickers had to be dropped. That removes both bankruptcies, where insider buying looks bad, and takeovers, where it looks good. The control groups come from the same surviving stocks, which limits the damage to the comparisons, but it does not remove it.
Download the data (CSV)
insider-purchases-2016-2026.csv: one row per insider purchase in the sample (34,652), Form 4 filings from January 2016 to June 2026. Columns: ticker, issuer, Form 4 filing date, insider role, purchase size in USD, number of insiders in the company buying within 30 days, and the stock’s return minus SPY over 30, 90 and 180 trading days after filing, in percent. Issuer names and roles come from public SEC filings; insider names are not included. Free to use and cite under CC BY 4.0 with attribution to BullpenBrief and a link to this page.
Methodology
Insider trades come from the SEC’s Insider Transactions Data Sets, the quarterly extracts of Forms 3, 4 and 5, covering filings from January 2016 to June 2026. We kept original Form 4 filings (not amendments) with non-derivative transactions coded P, an open-market or private purchase, by a reporting owner who is a director or an officer. Filings where the only relationship is a 10% owner, typically a fund, were excluded. Several filings by the same insider in the same company within five days were merged into one event, and only events of at least $25,000 were kept. That leaves 57,322 purchases, with a median size of about $106,000 among those we could price.
The event date is the date the form was filed, not the date of the trade, because that is when the public learns about it. Returns run from the close of the next trading day after filing, use dividend-adjusted prices from Yahoo Finance, and are measured against SPY over 30, 90 and 180 trading days. We dropped purchases where the stock traded under $1 (1,689), where Yahoo’s price on the trade date did not match the price in the filing within a third, a sign the ticker now belongs to another company (3,157), and where no price history exists (17,820).
Two control groups. The first takes two random days per purchase on the same stock, at least 180 days from any insider purchase in that company. The second takes three other stocks from the same universe on the same filing date, again with no insider purchase within 180 days. Confidence intervals are 95% bootstrap intervals on the difference in medians, resampling whole companies rather than single events, because purchases in one company come in series and their windows overlap. Figures, charts and the method are free to cite with attribution to BullpenBrief.