


Every time the Fed cuts, the same headline follows: what it means for mortgage rates. We checked all 58 Fed rate cuts since 1990 against Freddie Mac’s weekly 30-year mortgage rate. The answer is that most of the move has already happened by the time the Fed acts. In 48 of the 58 cuts, the 30-year rate had fallen over the 13 weeks before the decision, by 0.29 percentage points on average. In the 13 weeks after the cut, it moved by 0.03 points.
After a cut, the mortgage rate was higher three months later in 36% of cases. In an ordinary week with no cut nearby, it was higher three months later 42% of the time. That gap is well within the noise. For a borrower, a Fed cut is not a signal that mortgages are about to get cheaper. It is usually a sign that they already did.
Key findings
- In 48 of 58 Fed rate cuts from July 1990 to December 2025, the 30-year mortgage rate had already fallen over the 13 weeks before the decision, by 0.29 percentage points on average, against +0.01 in ordinary 13-week stretches (Freddie Mac PMMS, Federal Reserve data).
- Thirteen weeks after a Fed rate cut, the 30-year mortgage rate was higher in 36% of 58 cuts since 1990, against 41.8% of ordinary weeks; the 95% interval for the gap runs from -19 to +10 points, so it cannot be told apart from zero.
- Since the Fed began announcing its decisions, across 40 cuts from 1995 to 2025, the 30-year mortgage rate was higher 13 weeks later in 42.5% of cases, against 42.6% for ordinary weeks (Freddie Mac PMMS).
- After the first Fed cut of an easing cycle, the 30-year rate was higher four weeks later in 5 of 6 cases since 1990; after the September 2024 cut it went from 6.09% to 6.72% thirteen weeks later and 7.04% by mid-January 2025.
- Caveat: the 58 cuts fall into ten easing episodes with overlapping windows, so intervals are wide and the first-cut result rests on six cases. This is an average path, not a forecast.
Mortgage rates do their falling before the decision
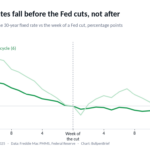
Mortgage rates follow long-term bond yields, and bond traders price in a cut as soon as it looks likely, often months ahead. The Fed’s own short-term rate only catches up on decision day. The chart shows the average path of the 30-year rate from 13 weeks before a cut to 13 weeks after, measured against the week of the decision.
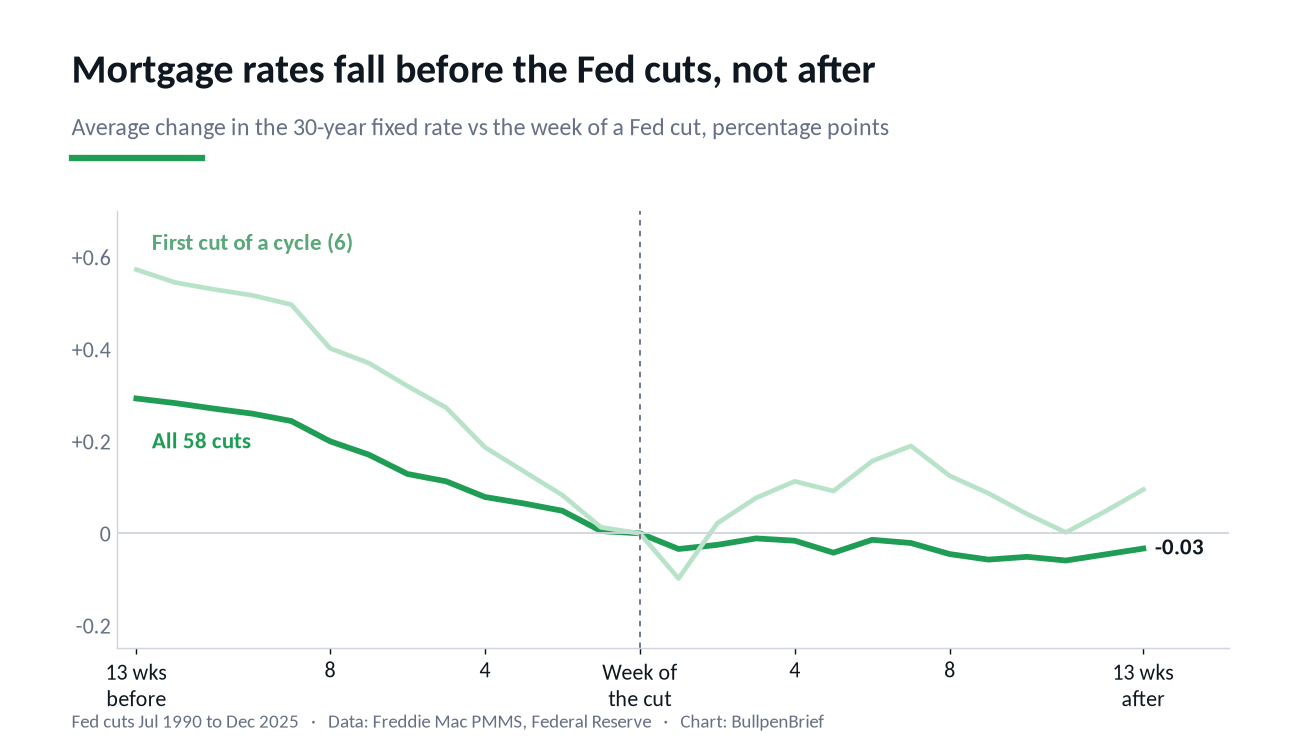
The line slides into the cut and goes flat after it. Over the 13 weeks before a cut the rate fell in 83% of cases, against 54% for ordinary 13-week stretches in the same years; the difference is 29 points, with a 95% interval of 15 to 41 points. The average drop of 0.29 points compares with a change of plus 0.01 points in ordinary stretches (interval for the difference minus 0.41 to minus 0.19). Before the first cut of an easing cycle the run-up is steeper: the rate had already fallen 0.57 points on average.
After the cut, a coin flip
The question most borrowers ask is whether to wait. Here is how often the rate was higher than in the week of the decision.
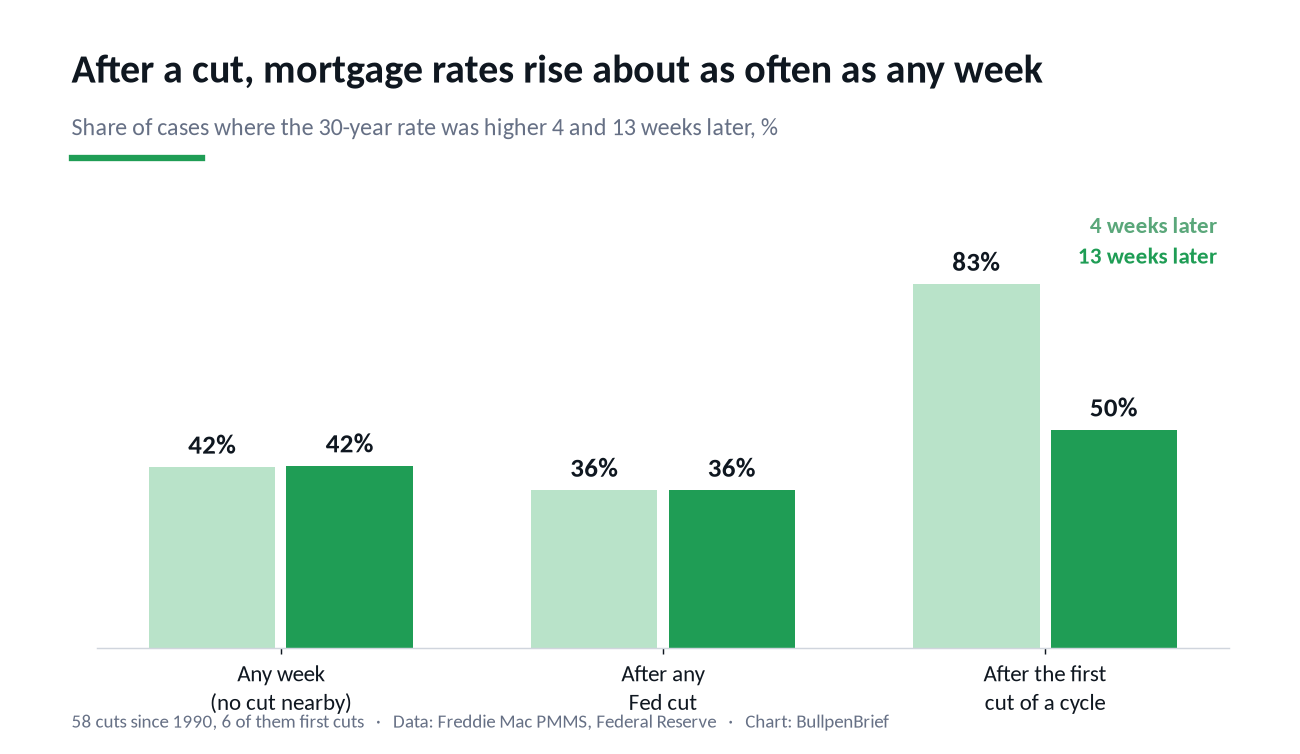
Four weeks after a cut, the rate was higher in 21 of 58 cases (36%), against 41.5% of ordinary weeks. Thirteen weeks after, again 21 of 58 (36%), against 41.8%. The 95% interval for the 13-week difference runs from minus 19 to plus 10 points, so we cannot tell it apart from zero. The average 13-week change was minus 0.03 points after a cut and minus 0.02 points after an ordinary week.
Even the slightly lower share after cuts comes from one stretch. Before February 1994 the Fed did not announce its decisions, and the 18 cuts of 1990 to 1992 came in a long, steady slide in rates: only 1 of them was followed by a higher mortgage rate four weeks later. Since the Fed started announcing, the picture is an even split. Of 40 cuts from 1995 to 2025, the rate was higher four weeks later in 20 and higher thirteen weeks later in 17 (42.5%), against 42.6% for ordinary weeks over the same years.
No single crisis carries the result. Leaving out the 2008 cuts, the share higher after 13 weeks is 33%; leaving out the two emergency cuts of March 2020, 37.5%; leaving out both, 35%. Every version sits within a few points of ordinary weeks.
The first cut of a cycle is the one that disappoints
The pattern is sharpest at the start of an easing cycle, the cut that gets the most coverage. Since 1990 the Fed has six times cut after a period of hikes: July 1995, September 1998, January 2001, September 2007, July 2019 and September 2024. Four weeks later the 30-year rate was higher in five of the six. The moves were mostly small, from 0.02 to 0.35 points, and thirteen weeks later the rate was higher in three of six, a plain coin flip. Six cases is too few to call this a rule, but it fits the run-up: when the first cut finally arrives, the bond market has usually spent months pricing it and has little left to give.
Emergency cuts between scheduled meetings look similar. Of eight since 1994, five were followed by a higher rate four weeks later and two by a higher rate thirteen weeks later.
What happened in 2024, 2025 and now
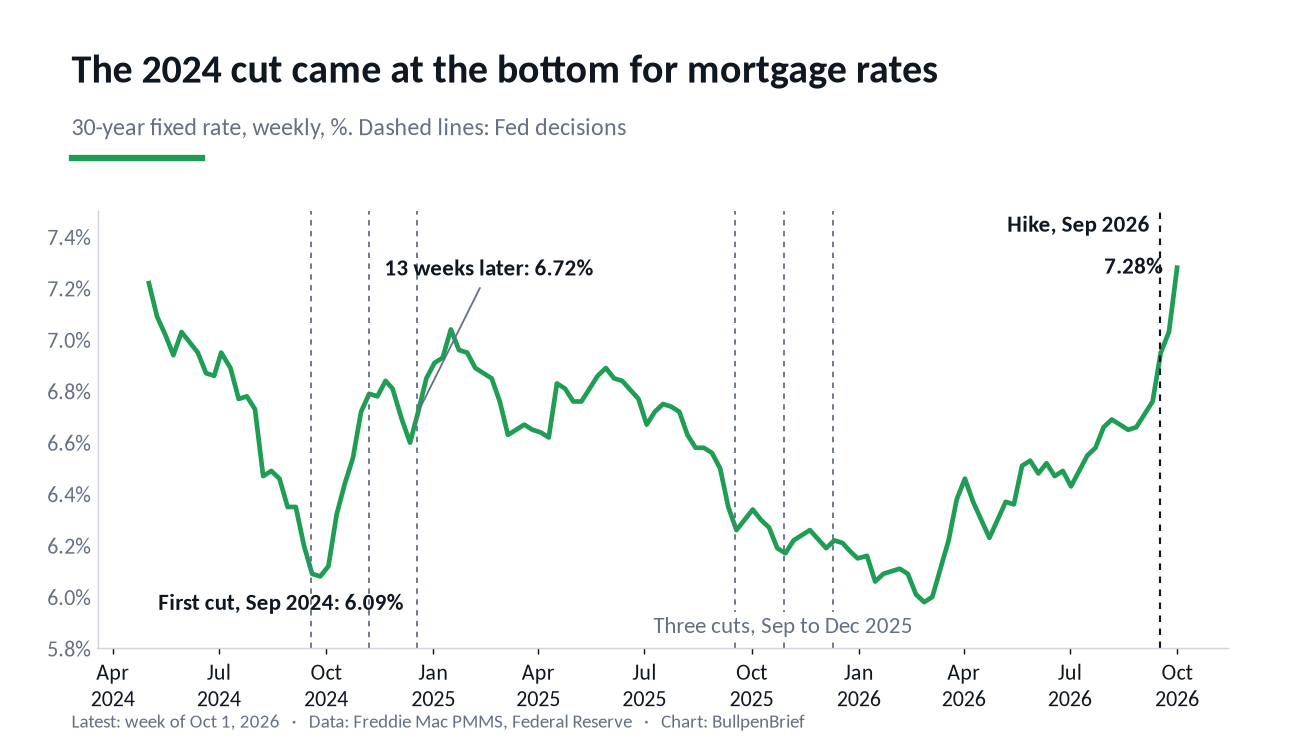
The September 2024 cut, a half point, is the textbook case. The 30-year rate fell from 6.87% in late June to 6.09% in the week of the decision, a drop of 0.78 points in 13 weeks. It touched 6.08% the week after and then turned. Thirteen weeks after the cut it was 6.72%, and by mid-January 2025 it was 7.04%, even though the Fed had cut twice more in between. That was the largest 13-week rise after any first cut in our data.
The three cuts of September to December 2025 went the other way, barely. The rate fell 0.55 points into the September decision, to 6.26%, and then hardly moved: 13 weeks after each of the three cuts it was 0.05 to 0.11 points lower. It reached its low of 5.98% in late February 2026 and has risen since. On September 16, 2026 the Fed raised its target range by a quarter point to 3.75% to 4.00%. In the latest Freddie Mac survey, for the week of October 1, the 30-year rate was 7.28%.
What this is not
This is not a finding that the Fed does not matter for mortgages. It matters a great deal, but through expectations: mortgage rates track the 10-year Treasury yield, which moves when markets change their view of where the Fed is heading. By the time a cut is announced, that view has usually been priced. A surprise, a cut nobody expected or a signal about the next ones, can still move rates, and our averages cannot separate those cases.
It is not a forecast either. Over any three months mortgage rates are driven by inflation data, the economy, Treasury supply and the spread lenders charge over Treasuries, and none of that is in this study. The samples are small: 58 cuts fall into ten easing episodes, and cuts in the same episode share overlapping windows, which is why our confidence intervals are wide.
And the Freddie Mac rate is a national average for well-qualified borrowers putting about 20% down. Your quote depends on your credit, down payment, points and lender. Since November 2022 Freddie Mac builds the average from applications submitted to it rather than from a lender survey, which may make recent weeks slightly less comparable with earlier decades.
Download the data (CSV)
fed-cuts-vs-mortgage-rates-1990-2025.csv: one row per Fed rate cut (58), July 1990 to December 2025. Columns: announcement date, baseline PMMS week, 30-year rate in that week, first cut of a cycle, unscheduled cut, easing cycle number, cut size in basis points, target after the cut, and the change in the 30-year rate in percentage points 4 and 13 weeks after and 13 weeks before. Free to use and cite under CC BY 4.0 with attribution to BullpenBrief and a link to this page.
Methodology
Mortgage rates are the weekly 30-year fixed rate from Freddie Mac’s Primary Mortgage Market Survey, history from 1971. Fed decisions are changes in the federal funds target or target range from the Federal Reserve’s open market operations tables, which start in 1990; we used every decrease from July 1990 to December 2025, 58 in total, including unscheduled cuts. Since 2015 the Fed lists the date a change took effect, one day after the announcement, so we moved those dates back to the announcement. Before February 1994 changes were not announced at the time, which is why we look at that period separately.
The baseline is the first weekly reading dated on or after the announcement. Freddie Mac collects its survey in the first days of the week and publishes on Thursday, so for the usual Wednesday or Thursday decision this reading reflects rates going into the decision, not after it. Changes are measured 4 and 13 weekly readings later and 13 readings earlier. A first cut is one whose previous Fed move was a hike. Emergency cuts are the eight cuts announced between scheduled meetings since 1994.
The control group is every other week from July 1990 on with no cut within two weeks either side, about 1,660 weeks. Confidence intervals are 95% bootstrap intervals that resample whole easing episodes for the cuts and whole calendar years for the control weeks, because neighbouring weeks and cuts in the same cycle are not independent. Figures, charts and the method are free to cite with attribution to BullpenBrief.