


Every DeFi dashboard sells the same thing: a number with a percent sign next to it. We checked how long those numbers actually survive. Across 2,353 episodes of a pool paying more than 20% in pools holding at least $1 million, the median high yield lasted nine days.
Key findings
- The median DeFi pool yield above 20% lasted 9 days (2,353 episodes in 580 pools holding at least $1 million, February 2022 to September 2026, DefiLlama yields data).
- Of 2,353 DeFi high-yield episodes (2022 to 2026), 67.4% were still above 20% after a week, 14.6% after a month and 3.5% after three months; once an episode ended, the median pool fell below 10% within 2 more days.
- Emission-funded DeFi yields lasted longer than fee yields: episodes where token rewards were at least half the yield ran a median 12 days (403 episodes), against 8 days for fee-driven episodes (1,889), with 21.1% versus 13.2% still above 20% a month later.
- Deposits did not chase high DeFi yields: in the median episode a pool’s deposits rose 1.2% while the yield was above 20% and stood 1.8% above the starting level 30 days after it ended.
- Caveat: Uniswap v3 accounts for 34.8% of episodes; without it the median is 8 days and 30-day survival 13.0%. Pools that no longer exist are underrepresented, which if anything makes durations look longer.
Nine days, and then it is gone
An episode starts when a pool’s smoothed yield crosses above 20% after a week below it, and ends when it drops back under. Two thirds of episodes are still alive after a week. After a month, 14.6%. After three months, 3.5%.
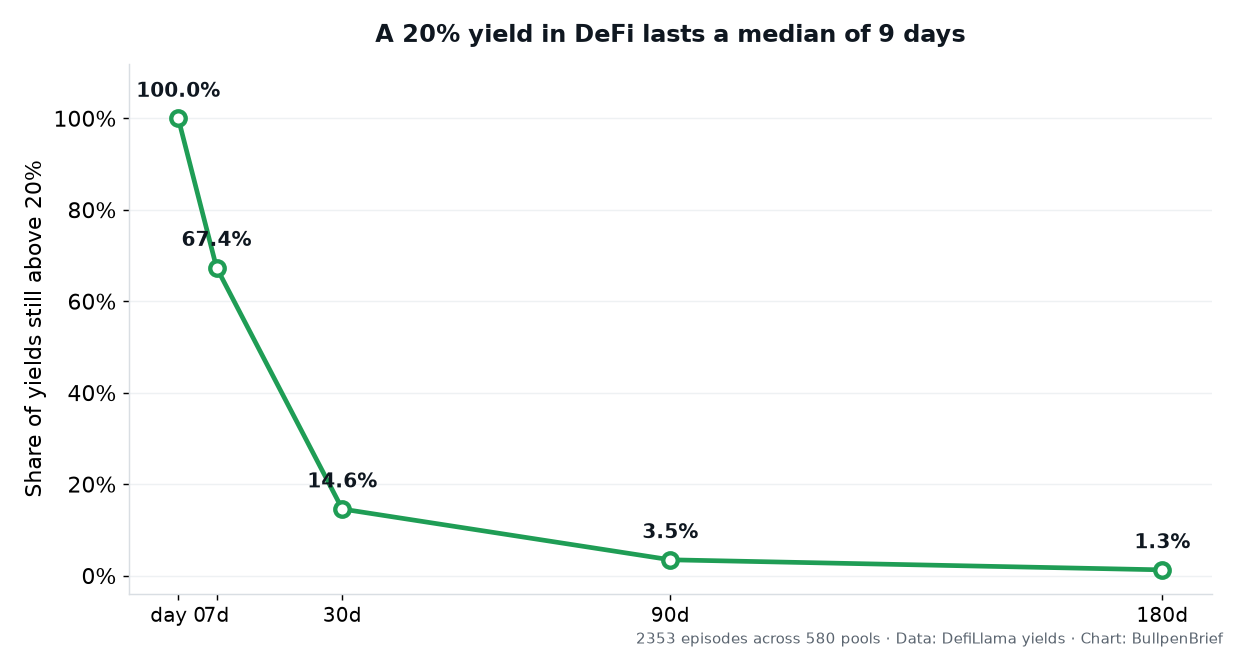
The ending is abrupt rather than gradual. Once an episode is over, the median pool takes two more days to fall below 10%. There is no long glide down to give a depositor time to react.
Bigger numbers do last longer, which is the one result that flatters the dashboards: episodes peaking above 50% ran a median of 25 days. Stablecoin pools, often sold as the steadier option, behaved no differently from the rest at nine days.
Emission yields outlast fee yields
The received wisdom is that yield paid in a protocol’s own token is fake and evaporates, while yield paid from trading fees is real and durable. The data says the opposite.
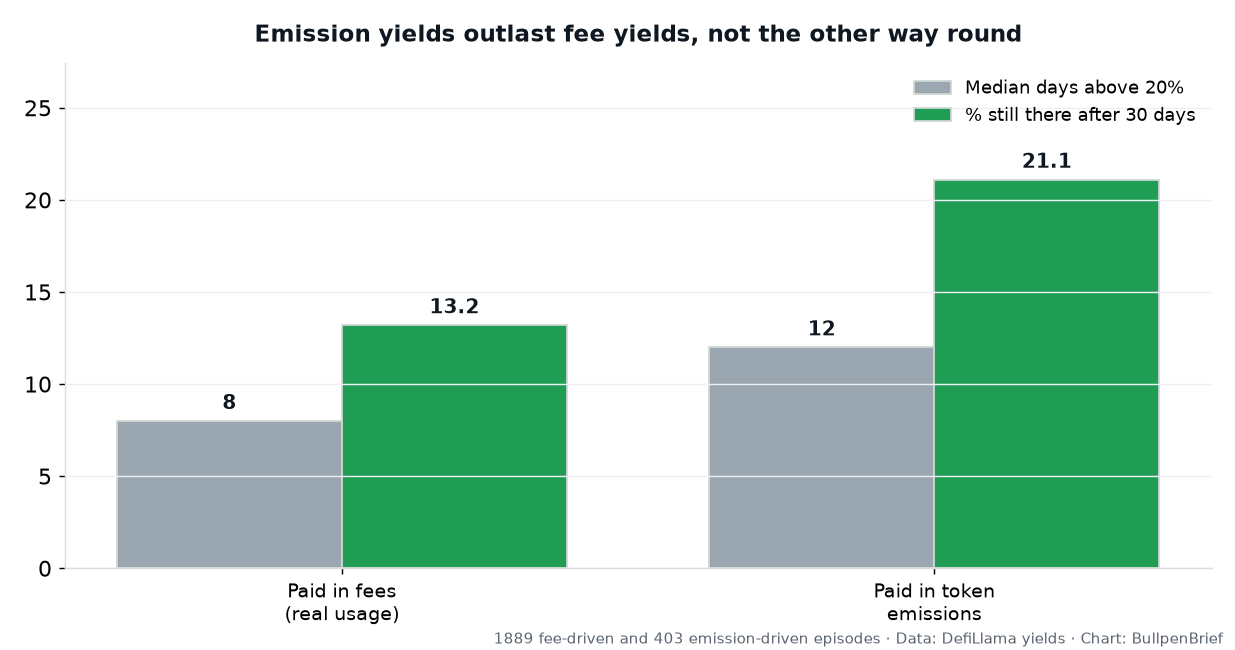
Episodes where rewards were at least half the yield ran a median of 12 days, and 21.1% were still above 20% a month later. Episodes driven mostly by fees ran 8 days, with 13.2% surviving a month.
The mechanism is unglamorous. Emissions are a schedule: a protocol decides to pay X tokens per day and keeps paying until the schedule changes. Fee yield is a consequence of trading volume, and volume spikes mean-revert within days. Durable does not mean good here. An emission yield reliably pays you in a token whose price is being diluted, which is a different risk, not a smaller one.
The money does not chase the yield
The standard story about mercenary capital says deposits flood a pool while the number is high and flee when it drops. In the median pool, neither happens.
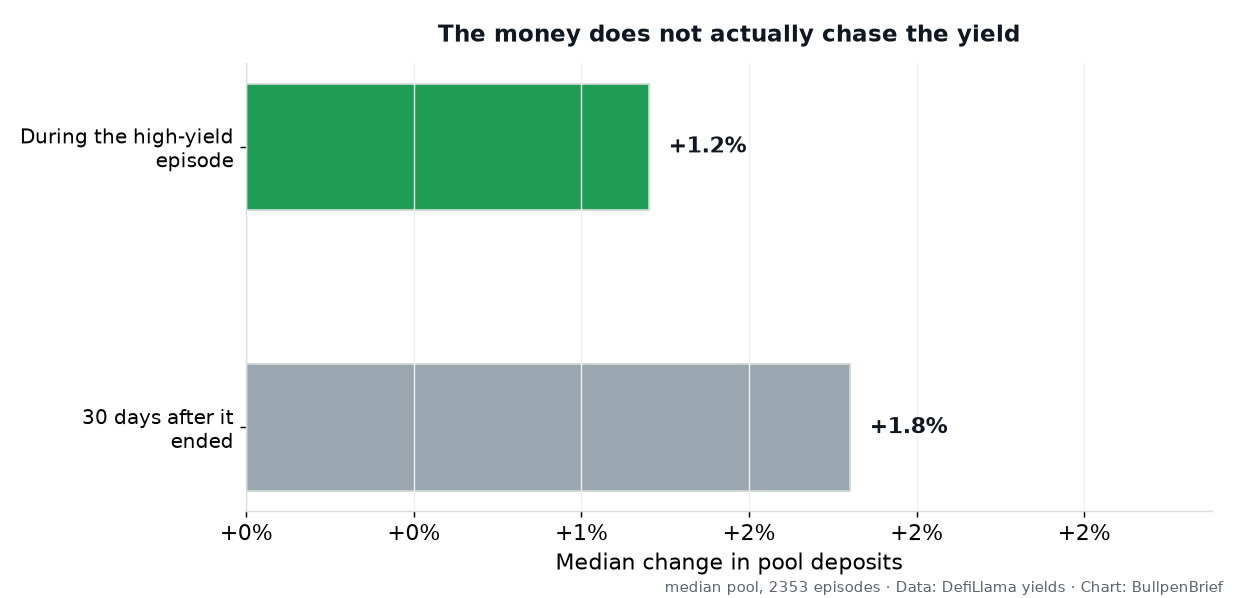
Deposits rise 1.2% over the whole episode and sit 1.8% above the starting level a month after it ended. Capital arrives late, in small amounts, and then stays after the reason for arriving has gone. The flood exists only in the handful of largest pools that get written about.
Why this matters
A yield figure on a dashboard is a snapshot of something with a median half-life of about a week. Quoting it as an annual rate is technically correct and practically misleading: almost nobody holds the position long enough for the annualisation to mean anything. If you are building a strategy around advertised APY, the number you need is not the rate, it is how long the rate lives, and nine days is the honest answer.
Download the data (CSV)
defi-yield-episodes-2022-2026.csv: one row per high-yield episode (2,353), February 2022 to September 2026. Columns: DefiLlama pool id, project, chain, symbol, stablecoin flag, start date, days above 20% (smoothed APY), peak and mean APY, share of yield paid in token rewards, deposits at start and end, deposit change during and 30 days after the episode, and days until the yield fell below 10%. Free to use and cite under CC BY 4.0 with attribution to BullpenBrief and a link to this page.
Methodology
Source is the DefiLlama yields API, pool list and per-pool daily history, retrieved 17 September 2026. We took every pool holding at least $1 million today, 2,693 of which returned usable history, covering 22 February 2022 to 10 September 2026.
Raw daily APY is too noisy to measure against. Fee-driven pools cross 20% for a single day dozens of times a year without offering anyone a real opportunity, and an early version of this analysis returned a median duration of one day, which measured that noise rather than yield. We therefore smooth each pool’s yield with a trailing seven-day median and require an episode to last at least three days. An episode must also be preceded by seven days below the threshold, so that a wobble around 20% is not counted as several separate events. Episodes still open at the end of the data are discarded, because their length is unknown.
One caveat on sample composition: the pool list is pools that exist today, so pools that died entirely are underrepresented, which if anything makes these durations look longer than reality. One caveat on concentration: Uniswap v3 accounts for 34.8% of episodes. Excluding it, the median falls from 9 days to 8 and 30-day survival from 14.6% to 13.0%, so the result does not rest on one protocol. Figures, charts and methodology are free to cite with attribution to BullpenBrief.