


When S&P Dow Jones Indices drops a company from the S&P 500 because it has shrunk, the headlines usually read like an obituary. We followed 143 stocks removed for size since 2008. The damage was done before the exit: in the year before they were dropped, the median stock trailed the S&P 500 by 46 percentage points, and 93% of them trailed it. After the exit there was no clear rebound and no clear further collapse. A year later the median survivor was 2.7 points behind the index, and 46% were ahead of it.
The longer view is harsher. Of the 143, 13 later went bankrupt and 30 were bought out or taken private. 100 still trade today.
Key findings
- Stocks removed from the S&P 500 for size trailed the index by a median of 46.3 percentage points in the 12 months before removal, and 93% of them trailed it (89 removals from 2008 to 2026, Yahoo Finance prices).
- After removal there was no measurable rebound: 12 months later the median removed stock was 2.7 points behind the S&P 500 (95% interval minus 21.0 to plus 7.0) and 46% beat the index (80 stocks, 2008 to 2025 removals).
- Of 143 stocks removed from the S&P 500 for market capitalization from June 2008 to October 2026, 13 later went through a Chapter 11 bankruptcy that wiped out or nearly wiped out the old shares, 30 were acquired or taken private and 100 still trade.
- Excluding the 2020 crash, stocks removed from the S&P 500 for size trailed the index by a median of 9.9 points over the next 12 months (95% interval minus 22.8 to plus 1.7), and 40% beat it (72 stocks).
- Caveat: returns cover only stocks that still trade, because Yahoo Finance keeps no history for most delisted companies; all 13 bankruptcies and 30 buyouts are missing from the return figures.
Before the exit: a lost year
A company leaves the S&P 500 for size when its market value has fallen too far behind the rest of the index, so it is no surprise that removed stocks arrive in bad shape. The size of the drop is the surprise. The median stock in our sample had done 46.3 points worse than the S&P 500 over the twelve months before its last day in the index. SolarEdge was 91 points behind when it left in December 2023, Enphase Energy 87 points behind in September 2025, Coty 82 points behind in September 2020.
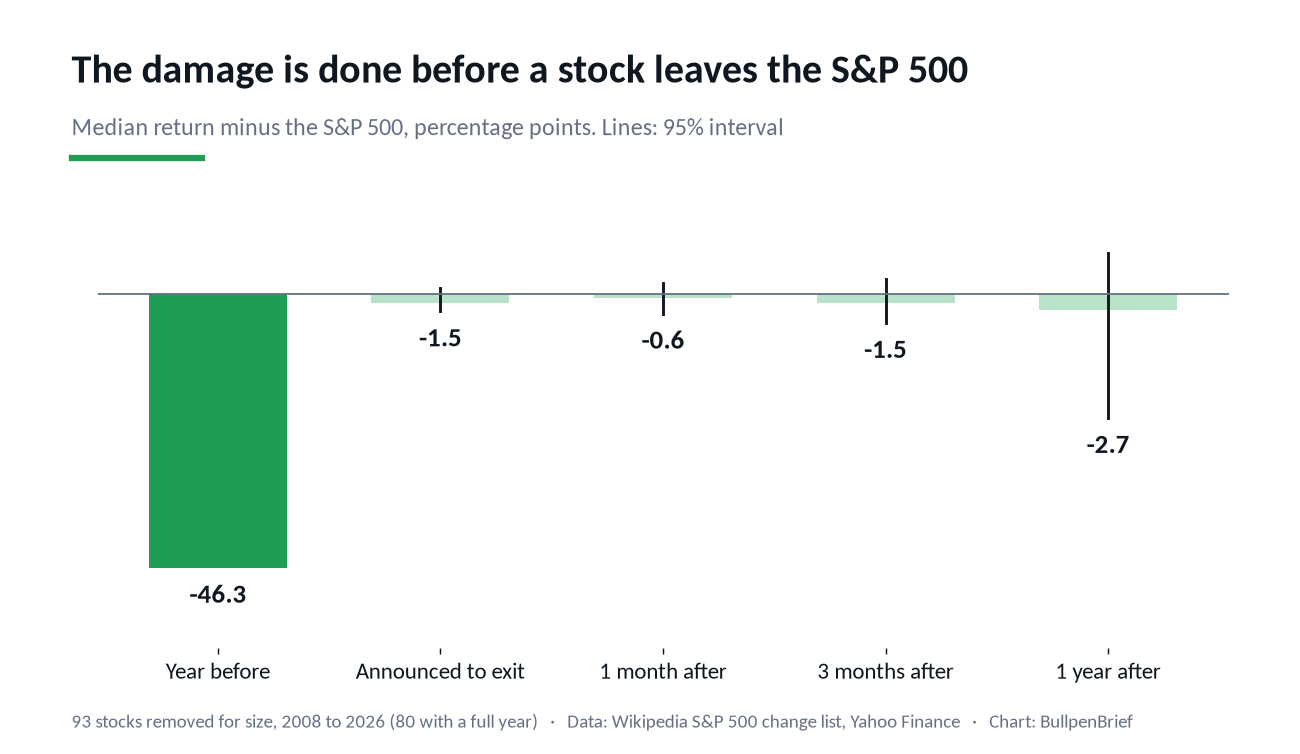
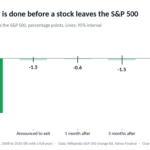
The last stretch, from the announcement to the day before the change takes effect, is when index funds have to sell. Over those days, a median of eleven calendar days, the median stock lost another 1.5 points against the index, and 57% of stocks fell behind it. The 95% interval runs from minus 2.9 to plus 1.0 points, so we cannot tell this apart from zero.
After the exit: no rebound on average
Academic studies from the 1990s and early 2000s found that deleted stocks tend to win back part of the price pressure once the index funds are done selling. In our sample that pattern is hard to find. Measured from the close of the last day in the index:
- One month later the median stock was 0.6 points behind the S&P 500 (95% interval minus 3.3 to plus 1.8), and 48% were ahead.
- Three months later it was 1.5 points behind (minus 4.9 to plus 2.6), and 41% were ahead.
- Twelve months later it was 2.7 points behind (minus 21.0 to plus 7.0), and 46% were ahead.
None of these is far enough from zero to call a pattern. Removed stocks usually move to the S&P MidCap 400, so we also compared them with that index: a year later the median was 0.6 points ahead of it and exactly half beat it. In plain dollar terms the median survivor gained 10.8% in its first year outside the index, and 54% made money.
To check whether removal matters at all, we compared each stock with itself: five random days at least a year away from its removal date. On those ordinary days the same stocks also trailed the S&P 500 a year later, by 2.8 points at the median. The gap between removal and an ordinary day was 0.1 points, with an interval from minus 19 to plus 11. Being dropped from the index did not change the path of these stocks in any way we can measure.
A year later it is a coin flip, and 2020 makes it look kinder
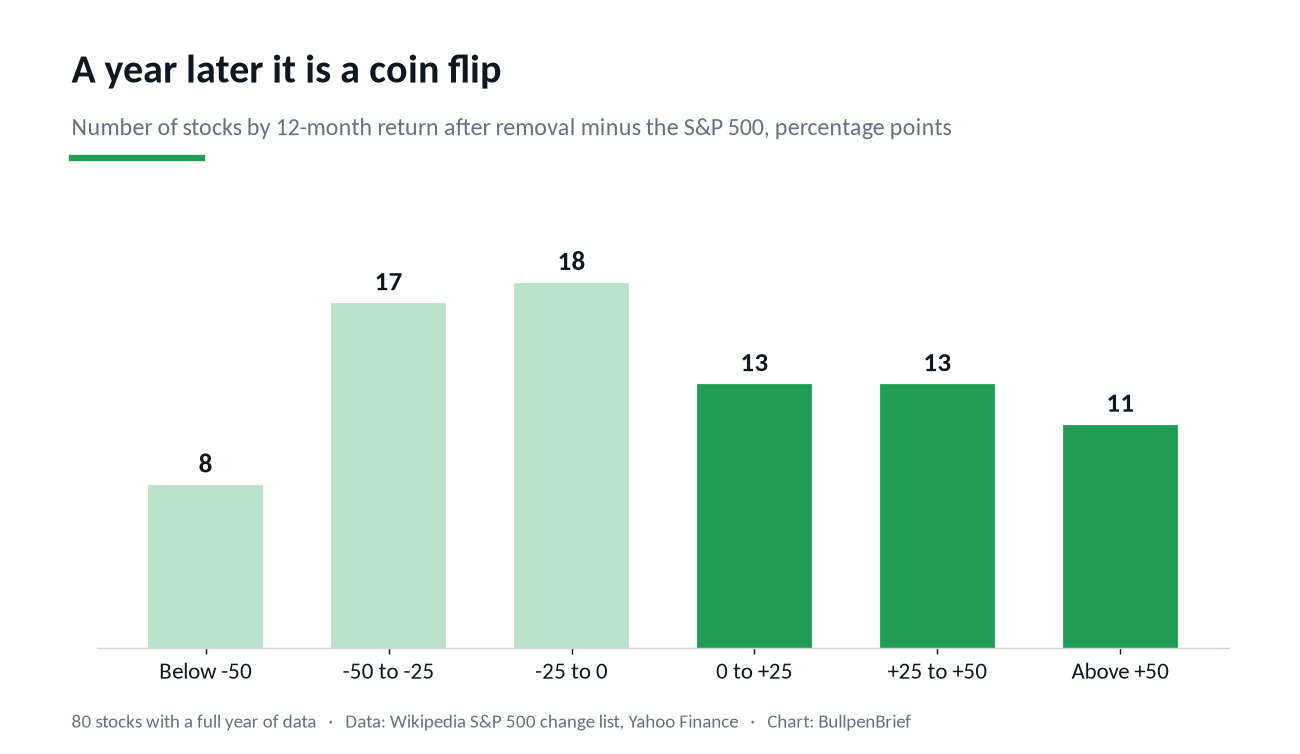
The spread is wide. Of 80 stocks with a full year of data, 25 did at least 25 points worse than the index and 24 did at least 25 points better. Many of the best results came from one moment: stocks dropped during the 2020 crash. Capri Holdings, removed in May 2020, beat the S&P 500 by 245 points over the next year. Macy’s, removed in April 2020, beat it by 169 points, and Coty and Kohl’s, both removed in September 2020, by 130 and 95. The eight stocks removed in 2020 beat the index by a median of 92 points.
Take 2020 out and the picture turns grey. For the other 72 stocks with a full year, the median result was 9.9 points behind the S&P 500 (95% interval minus 22.8 to plus 1.7), and only 40% beat it. Over three months the median was 1.7 points behind, with an interval of minus 4.9 to minus 0.1 that just excludes zero. That is a weak signal, but it points toward drift, not rebound.
The longer view: 13 bankruptcies
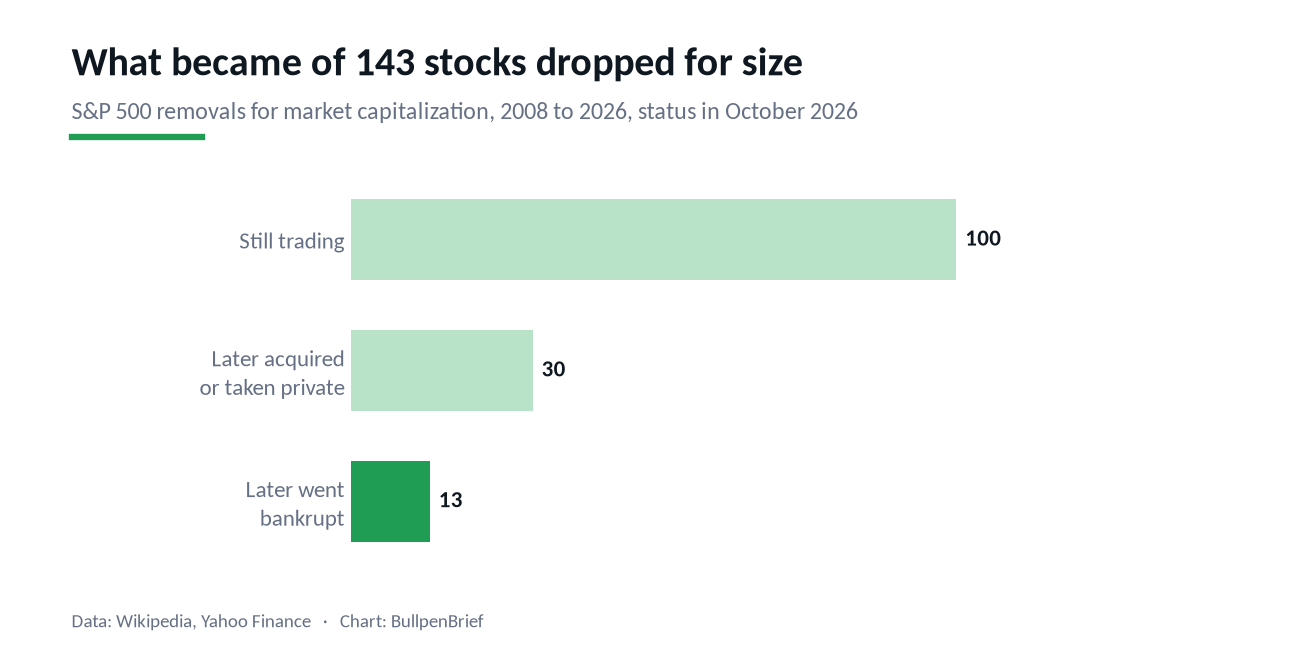
Of the 143 stocks removed for size since June 2008, 100 still trade under the same company. 13 later filed for Chapter 11 in a reorganization that wiped out or nearly wiped out the old shares: Ambac Financial, Eastman Kodak, Dynegy, RadioShack, SunEdison, Peabody Energy, Windstream, Denbury Resources, Frontier Communications, Mallinckrodt, Chesapeake Energy, Bed Bath & Beyond and Big Lots. The median bankruptcy came three years after the exit, and 11 of the 13 came within five years. Another 30 were acquired, merged or taken private, a median of five years after leaving the index, from Countrywide in 2008 to Comerica in 2026.
For comparison, the Wikipedia change list records 368 removals of all kinds since 2007. The largest group, 175, were not demotions at all: the company was bought by another firm and simply ceased to exist as a separate stock.
What this is not
This is not a buy signal or a sell signal. The returns are medians, before trading costs, and the intervals are wide because 93 stocks over 18 years is a small sample.
The main weakness is survivorship. Yahoo Finance keeps no price history for most companies that no longer trade, so the return figures cover only stocks that are still listed today. All 13 bankruptcies and all 30 buyouts are missing from them. That probably makes the after-exit numbers look better than reality, because the bankruptcies are left out, and in part worse, because takeover premiums are left out too. Early years are hit hardest: only 13 of the stocks in the return sample left the index before 2015. Those 13 did rebound, by 15 points over three months, but with an interval of minus 0.8 to plus 24.9 and a sample that excludes every early bankruptcy, we do not read much into it.
Download the data (CSV)
sp500-removals-2008-2026.csv: one row per S&P 500 removal for market capitalization, June 2008 to October 2026 (143 rows). Columns: effective date, announcement date, ticker, company, status in October 2026 (trading, acquired, bankrupt) and its year, return minus SPY in the 12 months before, from announcement to exit and 1, 3 and 12 months after, and the 12-month return minus MDY. Free to use and cite under CC BY 4.0 with attribution to BullpenBrief and a link to this page.
Methodology
Index changes come from the table of historical changes in the Wikipedia article “Historical components of the S&P 500” as of October 2026, which lists the effective date, the stock added, the stock removed, the reason and, for most rows, the S&P Dow Jones Indices press release with its date. We kept removals from 2007 onward, because the table is incomplete before that, and classified them by the stated reason. The return sample uses only removals for “market capitalization changes”, 143 events from June 2008 to October 2026. Removals caused by acquisitions, spin-offs and bank failures are counted separately.
Prices are daily closes adjusted for dividends and splits from Yahoo Finance. Where a company is still listed under a new ticker (Gap, Bread Financial, HF Sinclair, Fortune Brands, Viavi, Leidos), we used the new one. We required Yahoo’s history to cover the removal date and the company name to match, which drops tickers now used by another company. Entry is the close of the last trading day in the index, the day before the effective date. By then the change has been public for days, so there is no look-ahead. The announcement window runs from the close on the day of the press release to the same exit close. Returns are measured over 21, 63 and 252 trading days against SPY and against MDY, an S&P MidCap 400 fund.
We excluded 37 removals with no price history, 6 whose ticker now belongs to another company or whose history Yahoo cut short, 2 that traded under $1 (Fannie Mae and Freddie Mac in September 2008), 4 too recent for a one-month result, and the second share class of Under Armour, leaving 93 stocks. The control group takes five random trading days per stock, at least a year from its removal. Confidence intervals are 95% bootstrap intervals on the median. The largest single result, Capri Holdings, accounts for 12.8% of all positive one-year results; without the top three the median moves from minus 2.7 to minus 5.4 points, in the same direction. The later fate of the 43 stocks that no longer trade was checked against company histories on Wikipedia. Figures, charts and the method are free to cite with attribution to BullpenBrief.