

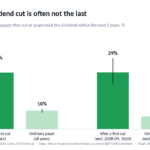

When a company cuts its dividend, management usually presents it as a one-time reset. We checked how often that holds. Across 349 first dividend cuts by companies now in the S&P 1500, from 2000 to 2024, 29% were followed by another cut or a full suspension within two years. For an ordinary dividend payer with no recent cut, the chance of a cut over any two-year stretch was 9.5%. A first cut roughly triples the odds of a second one.
The stock does not tell you much either. Outside the 2008-09 crisis and the 2020 crash, the median company that cut was 1.5 points behind the S&P 500 a year later and 8.7 points behind after two years. Only 22% had paid their old dividend again within five years.
Key findings
- Of 349 first dividend cuts by companies now in the S&P 1500, from 2000 to 2024, 29.2% were followed by another cut or a suspension within two years (95% interval 24.6% to 34.1%), against 9.5% for ordinary dividend payers over any two-year stretch (Yahoo Finance dividend history).
- Outside 2008-09 and 2020, 29.3% of 181 first dividend cuts were followed by another within two years, against 6.6% for ordinary payers in the same years, about four times the base rate.
- Only 21.9% of companies that cut their dividend between 2000 and 2021 paid their old dividend level again within five years (320 first cuts, current S&P 1500 members).
- Stocks trailed the S&P 500 by a median of 25.8 percentage points in the 12 months before a first dividend cut; outside the 2008-09 and 2020 crashes they were still 1.5 points behind a year after the cut and 8.7 points behind after two years (181 cuts).
- First dividend cuts of more than 75% were followed by another cut or suspension 15% of the time (72 cuts), against 29% to 36% for smaller cuts.
- Caveat: the sample covers only companies in the S&P 1500 in October 2026, so firms that cut and later went bankrupt or were acquired are missing; the true repeat rate is probably higher.
Three times the normal rate
We started from the dividend history of every company in the S&P 500, S&P MidCap 400 and S&P SmallCap 600 as of October 2026. 1,042 of them paid a regular dividend at some point from 2000 to 2024. We marked a “first cut” when a regular payment came in at least 10% below the previous one, with no cut or suspension in the two years before. The median first cut was 50%.
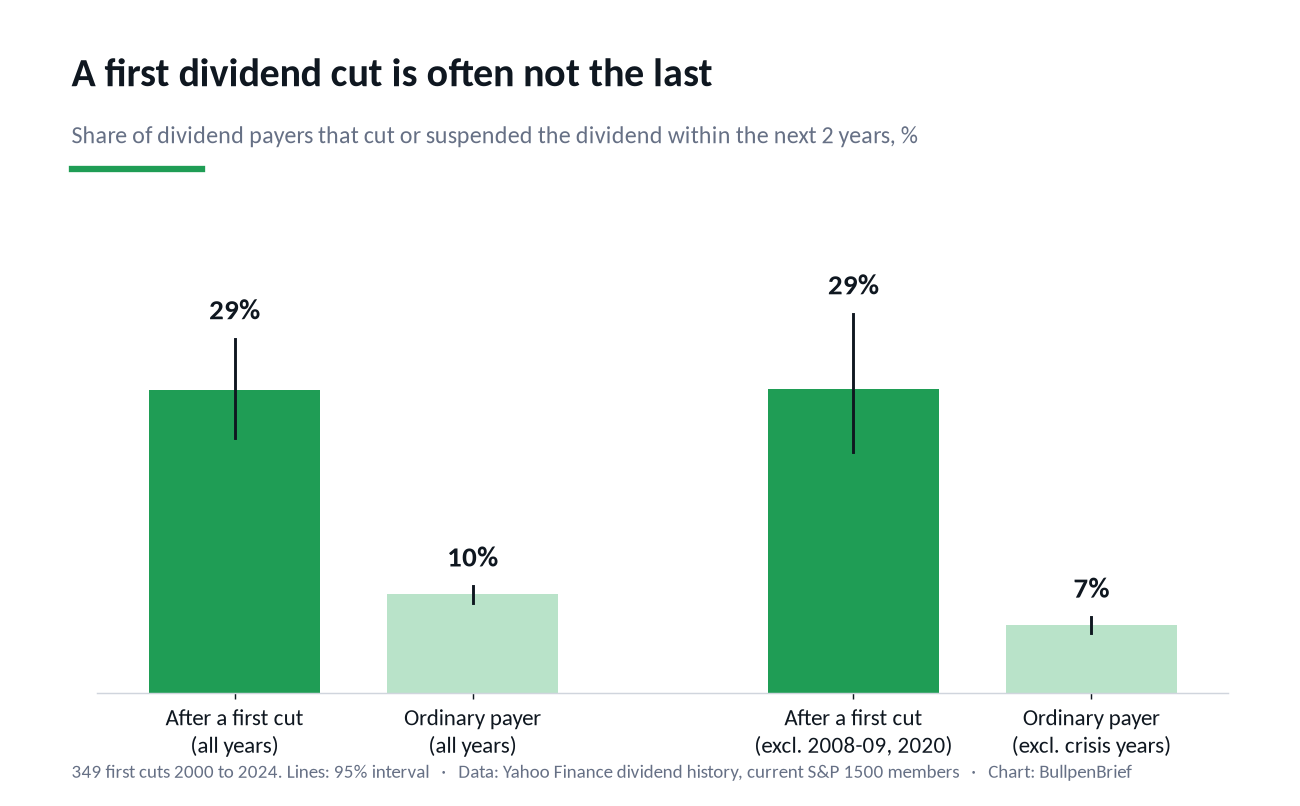
Of the 349 first cuts, 102 were followed within 730 days by another step down: 58 companies cut again and 44 suspended the dividend altogether. That is 29.2%, with a 95% interval of 24.6% to 34.1%. Most second cuts came fast: 22.9% of all first cutters had cut again within a year, and the median gap was 227 days, about two quarterly payments.
The comparison group is the same set of companies on ordinary days. We drew 5,092 random payment dates from 1,035 payers, each with no cut or suspension in the two years before, and checked whether a cut followed in the next two years. That happened 9.5% of the time (8.7% to 10.3%). The gap between the two groups is 20 points, with an interval of 15 to 25.
Crashes change the pattern, but not the conclusion
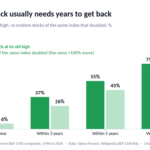
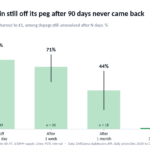
Almost half of all first cuts came in three years: 2008, 2009 and 2020. They behaved very differently. Banks that cut in 2008 usually cut in stages: of 48 first cuts that year, 34 (71%) were followed by another within two years, among them Citigroup, Bank of America, KeyCorp, Fifth Third and Regions Financial. In 2020 it was the opposite. Of 47 first cuts during the pandemic, only 2 were followed by a second.
Take those three years out and the rate barely moves: 29.3% of 181 first cuts (23.2% to 36.5%) were followed by another, while the base rate for ordinary payers in calmer years drops to 6.6%. Outside a crash, a first cut makes a second one about four times as likely.
A deep cut is more often the last one
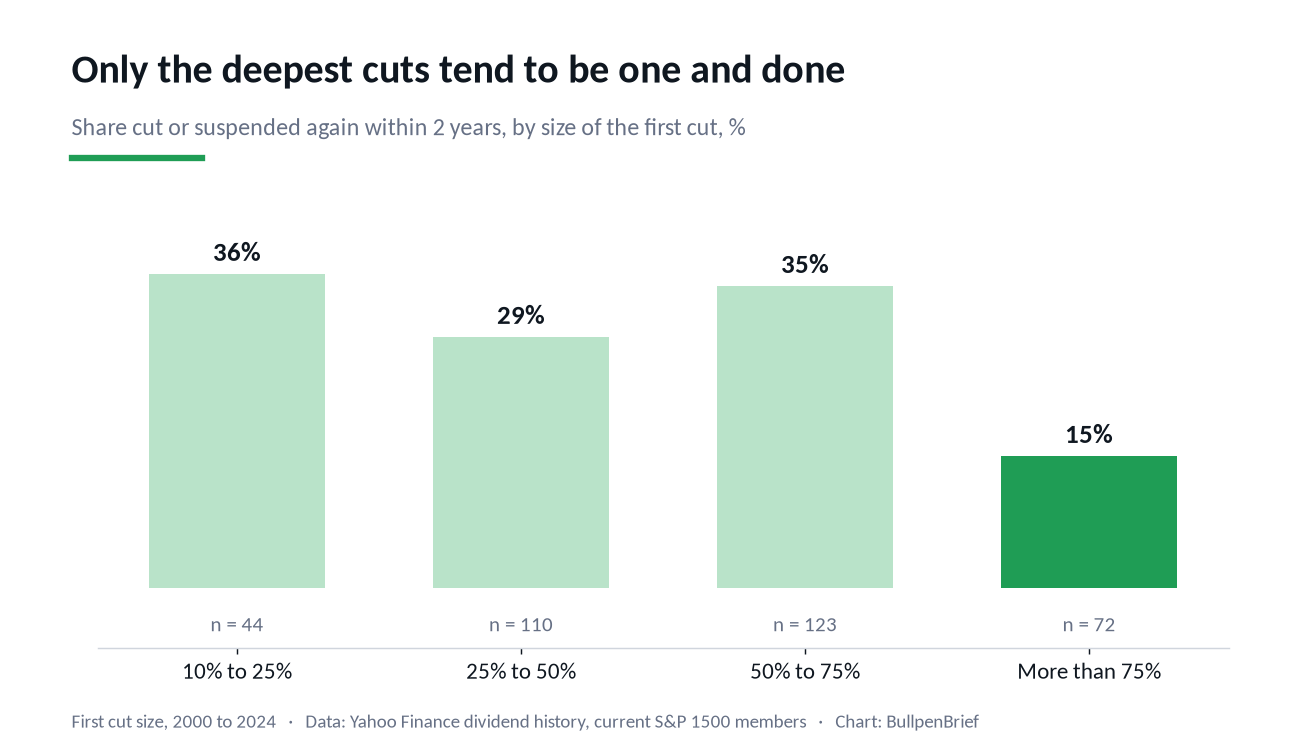
The size of the first cut matters at the extreme. Companies that cut by more than 75% were followed by another cut or a suspension 15% of the time (6.9% to 23.6%, 72 cuts). Companies that cut by 10% to 25% did so 36% of the time, and those in between 29% to 35%. A company that slashes the dividend to a token amount has less room left to cut. The groups below 75% are too close to separate from each other.
Size of the company matters as well. Among first cuts by today’s S&P 500 members, 20.2% were followed by another (114 cuts). For the MidCap 400 it was 28.7% (94) and for the SmallCap 600, 36.9% (141). By sector, consumer discretionary companies cut again most often (50% of 36) and financials next (38% of 99). Utilities (10% of 21) and energy companies (12% of 34) rarely did, though both samples are small.
Suspensions: half come back within two years
We also counted 261 first suspensions, when a regular payer skipped a payment entirely. A little more than half, 50.6% (44.4% to 56.3%), paid again within two years, and the median wait was 415 days. One in five, 19.9%, has not resumed the dividend as of October 2026.
For the cuts, recovery is slower. Of 320 first cuts with five years of history after them, only 21.9% (17.5% to 26.2%) brought the dividend back to its old level within five years.
What happens to the stock
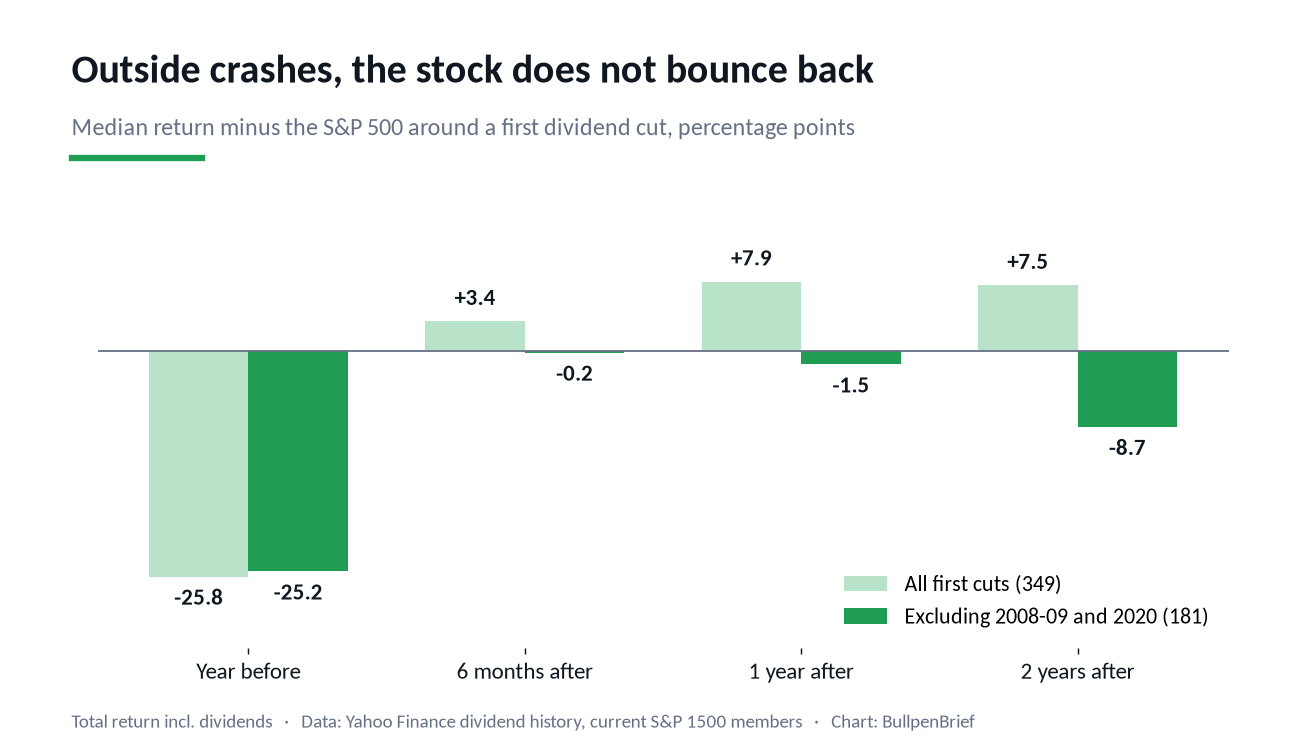
The bad news arrives well before the cut. In the twelve months before the ex-dividend date of the first lower payment, the median stock trailed the S&P 500 (total return, SPY) by 25.8 points, and 81% of them trailed it. Over the last 60 trading days alone the median was 8.8 points behind, which is where the announcement itself usually falls.
After the cut, the full sample looks like a rebound: a year later the median stock was 7.9 points ahead of the S&P 500 (2.9 to 12.2), and 58.5% beat it. Compared with the same stocks on random days at least a year from any cut, that is 6.8 points better (1.6 to 11.4). But the rebound belongs to the crashes. Companies that cut in March 2009 or the spring of 2020 bounced back with the whole market. Without those years:
- Six months later the median stock was 0.2 points behind the S&P 500, and 49.7% were ahead.
- One year later it was 1.5 points behind (minus 9.0 to plus 4.1), and 49.2% were ahead.
- Two years later it was 8.7 points behind (minus 12.3 to plus 2.6), and 44.2% were ahead.
None of these is far enough from zero to call a pattern, but the direction is not a rebound. The split between companies that cut again and those that did not is stark: the 102 repeat cutters were a median 23.9 points behind the index a year after the first cut, while the 247 that held the new dividend were 18.0 points ahead. That gap is only visible in hindsight, since nobody knows on the day of the first cut which group a company will end up in.
What this is not
This is not a buy or sell signal. The returns are medians before trading costs, and the intervals are wide.
The biggest weakness is survivorship. We started from companies in the S&P 1500 today, because free data on companies that no longer trade is patchy. Firms that cut their dividend and then went bankrupt or were bought out are missing, and many of them would have cut again before they disappeared. The true repeat rate is probably higher than 29%, and the stock returns after a cut are probably worse than shown. The comparison group comes from the same surviving companies, so the gap between a first cut and an ordinary year is a fairer figure than either number alone.
A dividend cut is also not always a sign of trouble. Some companies cut when they spin off a division, and we removed those we could identify. Others cut to fund buybacks or pay down debt from a position of strength. Our data cannot tell those motives apart.
Download the data (CSV)
dividend-cuts-2000-2024.csv: one row per first dividend cut or suspension by a current S&P 1500 member, January 2000 to October 2024 (610 rows). Columns: date, ticker, company, GICS sector, index, event (cut or suspend), size of the cut, whether another cut or suspension followed within two years and after how many days, days to resume, whether the old level was restored within five years, and return minus SPY 12 months before and 6, 12 and 24 months after. Free to use and cite under CC BY 4.0 with attribution to BullpenBrief and a link to this page.
Methodology
Company lists come from the Wikipedia articles “List of S&P 500 companies”, “List of S&P 400 companies” and “List of S&P 600 companies” as of October 14, 2026 (1,500 tickers, with GICS sectors). Dividend payments (ex-dividend date and amount per share, adjusted for splits) and daily prices adjusted for dividends and splits come from Yahoo Finance, from 1995 onward. 1,042 companies paid at least four regular dividends from 2000 to 2024.
We first removed special dividends: a payment more than 1.5 times the median of the four payments on either side, or a second payment within 20 days of another. A cut is a regular payment at least 10% below the previous regular payment and below the payment a year earlier, at the company’s usual frequency. A switch to more frequent payments, a one-off extra that was later dropped, and a payment split in two do not count. A suspension is a regular payer (quarterly or more often) going more than twice its usual interval plus 30 days without a payment; we date it 45 days after the missed payment was due. A first cut or suspension has none in the two years before it and at least four regular payments before it. Events run from January 2000 to October 14, 2024, so every one has two full years of follow-up.
Over 2000 to 2024 we set aside 31 cuts linked to spin-offs (Yahoo records the price adjustment for most spin-offs, and we added nine older cases by hand, including Altria in 2007 and 2008 and Equifax in 2001), 95 cuts reversed within the next two payments, which in Yahoo data are mostly recording errors around splits and payment shifts, 17 first cuts by companies with variable dividends (at least two decreases among the eight payments before) and 3 stocks under $1. This check uses up to six months of information after the cut, so cuts reversed that quickly are not in the sample. Stock returns are measured from the close on the ex-dividend date of the first lower payment, when the cut is already public, against SPY over 126, 252 and 504 trading days. The control for stock returns takes five random days per company at least a year from any cut or suspension. Intervals are 95% bootstrap intervals. The largest single result, SM Energy after its April 2020 cut, accounts for 6.2% of all positive one-year results; without the top three the one-year median moves from 7.9 to 7.6 points. Figures, charts and the method are free to cite with attribution to BullpenBrief.