
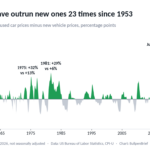


When the Fed raises rates, your credit card bill notices almost at once. When it cuts, the relief is smaller. We matched every quarterly reading of the Federal Reserve’s credit card rate survey since November 1994, 128 of them, against 88 changes in the Fed’s target rate. Since 2010, card rates have caught up with a hike within about two quarters. In each of the four big cutting cycles since 2000, they came down by less than 60% of the Fed’s cut.
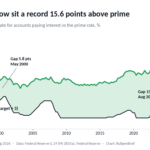
The result is a gap that only seems to widen. In August 2026 the average rate charged on accounts that pay interest was 22.36%, while the prime rate, which most card rates are set from, was 6.75%. That is a gap of 15.6 points, the widest in the 32 years of data. In May 2000 it was 5.8 points.
Key findings
- In August 2026 the average US credit card rate on accounts paying interest was 22.36%, 15.6 points above the 6.75% prime rate, the widest gap in Federal Reserve G.19 data going back to November 1994 (the low was 5.8 points in May 2000).
- From 1995 to 2026, the gap between credit card rates and the prime rate widened by 0.27 points per quarter more in quarters around Fed rate cuts than in quarters with no Fed move (95% interval 0.07 to 0.45; 38 cut quarters, 42 quiet quarters), and did not change around hikes (minus 0.03 points).
- Since 2010, a Fed rate hike has shown up in full in the average US credit card rate by the next quarterly reading: 1.50 points per point of hike (95% interval 0.76 to 2.22), and 1.24 points a year later (Federal Reserve G.19, 66 quarters).
- In each of the four Fed cutting cycles of 1.5 points or more since 2000, the average credit card rate fell by less than 60% of the cut: 2.3 of 5.5 points in 2001 to 2003, 0.3 of 5.0 in 2007 to 2008, 0.8 of 2.25 in 2019 to 2020 and 1.0 of 1.75 in 2024 to 2025.
- From February 2022 to February 2024 the Fed raised its target by 5.25 points and the average US credit card rate on accounts paying interest rose 6.46 points, from 16.17% to 22.63%.
- Caveat: the card rate is a bank-survey average, so changes in who carries a balance and in expected defaults move it alongside issuer margins; and with only seven quarters of Fed cuts since 2010, the model alone cannot prove cuts pass through less than hikes.
The gap opens when the Fed cuts
Most US credit cards charge a variable rate: the prime rate, which banks set at the Fed’s target plus 3 points, plus a margin the issuer chooses. If issuers kept their margins steady, the card rate would move one for one with the Fed and the gap in the chart below would be flat. It is not.
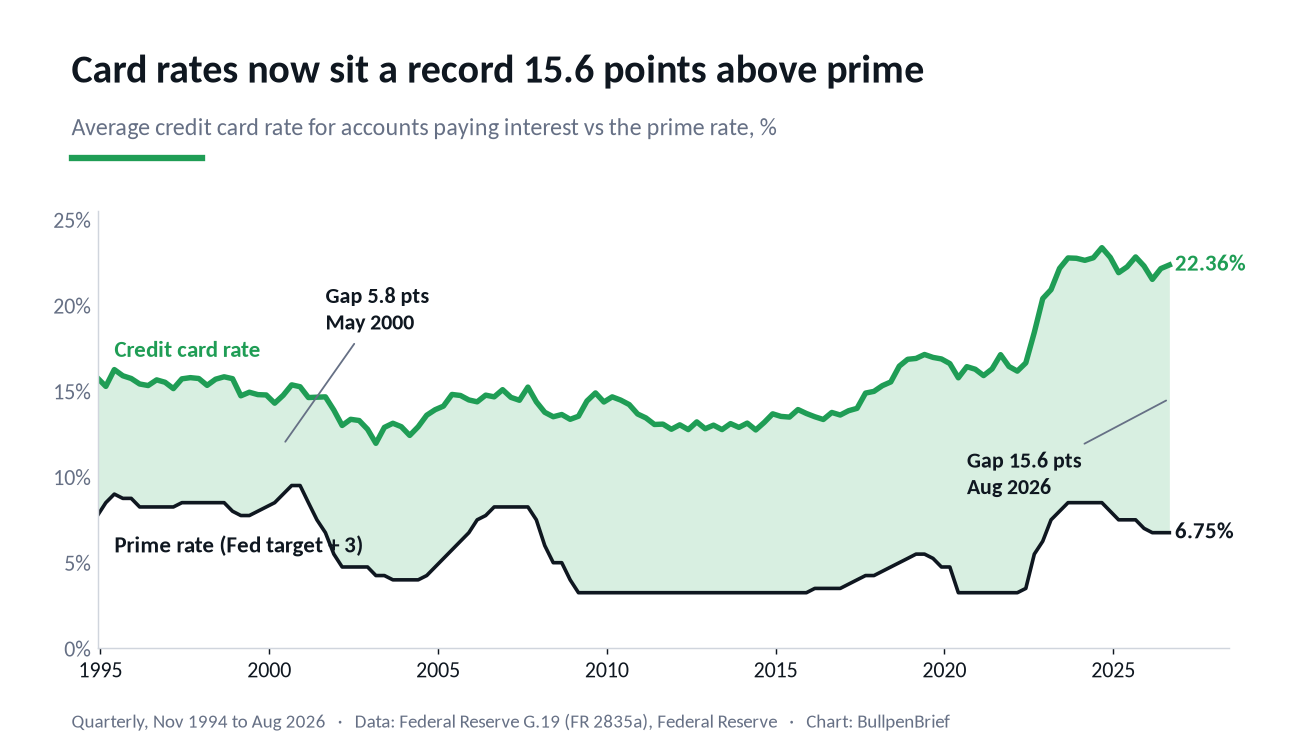
We split the 123 quarters with a full history into three groups: quarters with a Fed cut in that quarter or the two before it, quarters around a hike, and quiet quarters with no Fed move at all. After removing the regular seasonal swing in the survey, the gap between card rates and prime widened by 0.27 points per quarter more around cuts than in quiet quarters (95% interval 0.07 to 0.45 points, 38 cut quarters against 42 quiet ones). Around hikes it did not change: minus 0.03 points per quarter (interval minus 0.21 to plus 0.15).
Add it up and the pattern is plain. In the quarters around Fed cuts the gap widened by a combined 9.8 points. In all the other quarters together it narrowed by 2.2 points. That is how 8.0 points in November 1994 became 15.6 points today.
One episode does a lot of the work: the cuts of 2008, followed by the 2009 run-up to the CARD Act, when issuers raised rates before new limits on repricing took effect. Those two years account for about half of the widening around cuts. Without them the effect is smaller, 0.17 points per quarter, but still clear of zero (interval 0.02 to 0.33). Looking only at 2010 onward, it is 0.20 points per quarter (interval 0.01 to 0.40).
Cycle by cycle
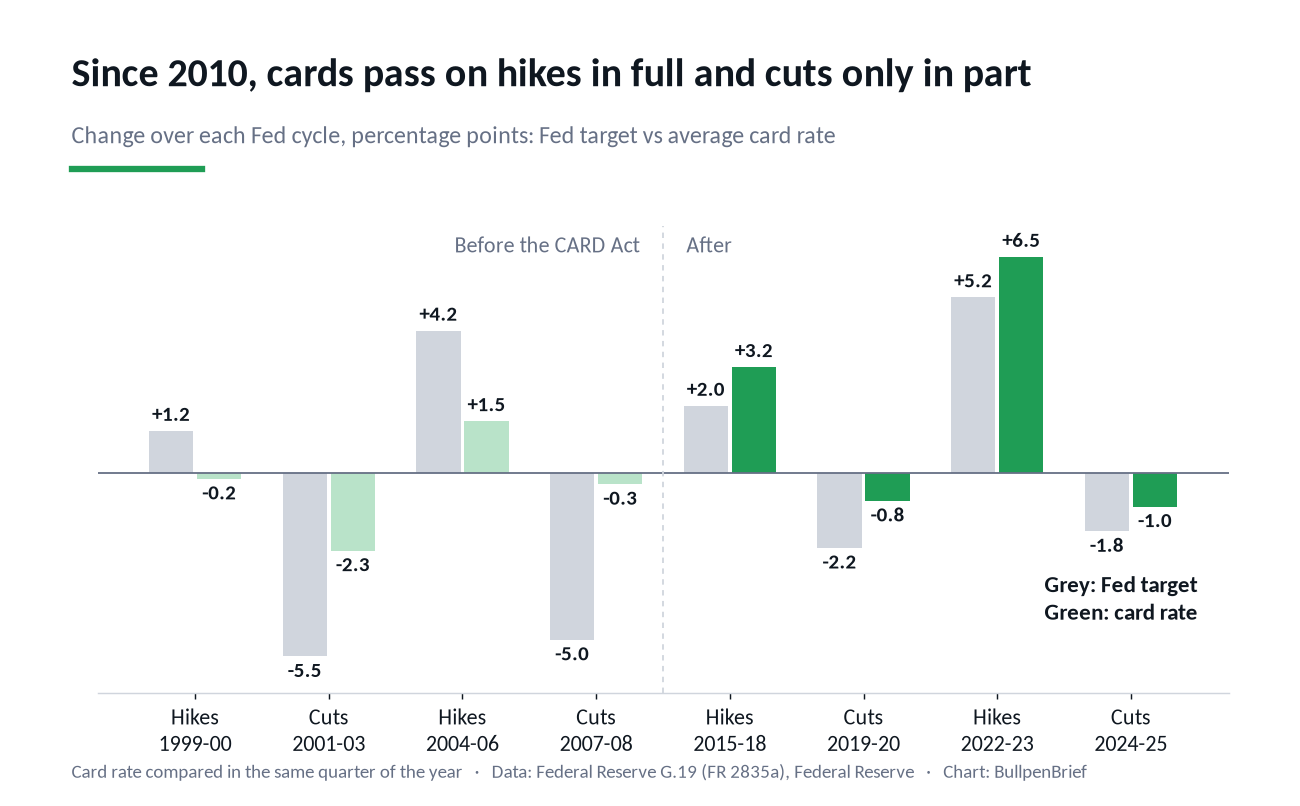
The chart compares each Fed cycle of 1.5 points or more with what happened to the card rate over the same stretch, measured in the same quarter of the year because the survey has a seasonal pattern. Before 2010, many cards still carried fixed rates, and card rates barely followed the Fed in either direction: up 1.5 points in the 2004 to 2006 hikes against 4.25 for the Fed, and down 0.3 points in the 2007 to 2008 cuts against 5.0.
Since 2010 the hikes have gone through in full and then some. From February 2022 to February 2024 the Fed target rose 5.25 points and the average card rate rose 6.46 points, from 16.17% to 22.63%. Three quarters into that cycle, in November 2022, cards were already up 4.23 points against 3.0 for the Fed.
The cuts have not. After the 2019 to 2020 cuts, 2.25 points, the card rate was 0.84 points lower in May 2021 than in May 2019. The current cycle looks the same so far. The Fed cut 1.75 points between September 2024 and December 2025. In August 2026 the average card rate was 22.36%, 1.01 points below August 2024. It did dip to 21.52% in February 2026, but February readings are usually low and the rate has drifted back up since.
How fast a hike reaches your statement
To answer the timing question directly, we estimated how much of each Fed move shows up in the card rate in the same quarter and in each of the next four, with hikes and cuts allowed to work differently and with seasonal effects removed. For 2010 to 2026 the answer for hikes is quick: about two thirds of a hike appears in the quarter of the move and the full amount by the next survey, 1.50 points per point of hike (interval 0.76 to 2.22). A year later the total is 1.24 points per point (interval 0.93 to 2.56).
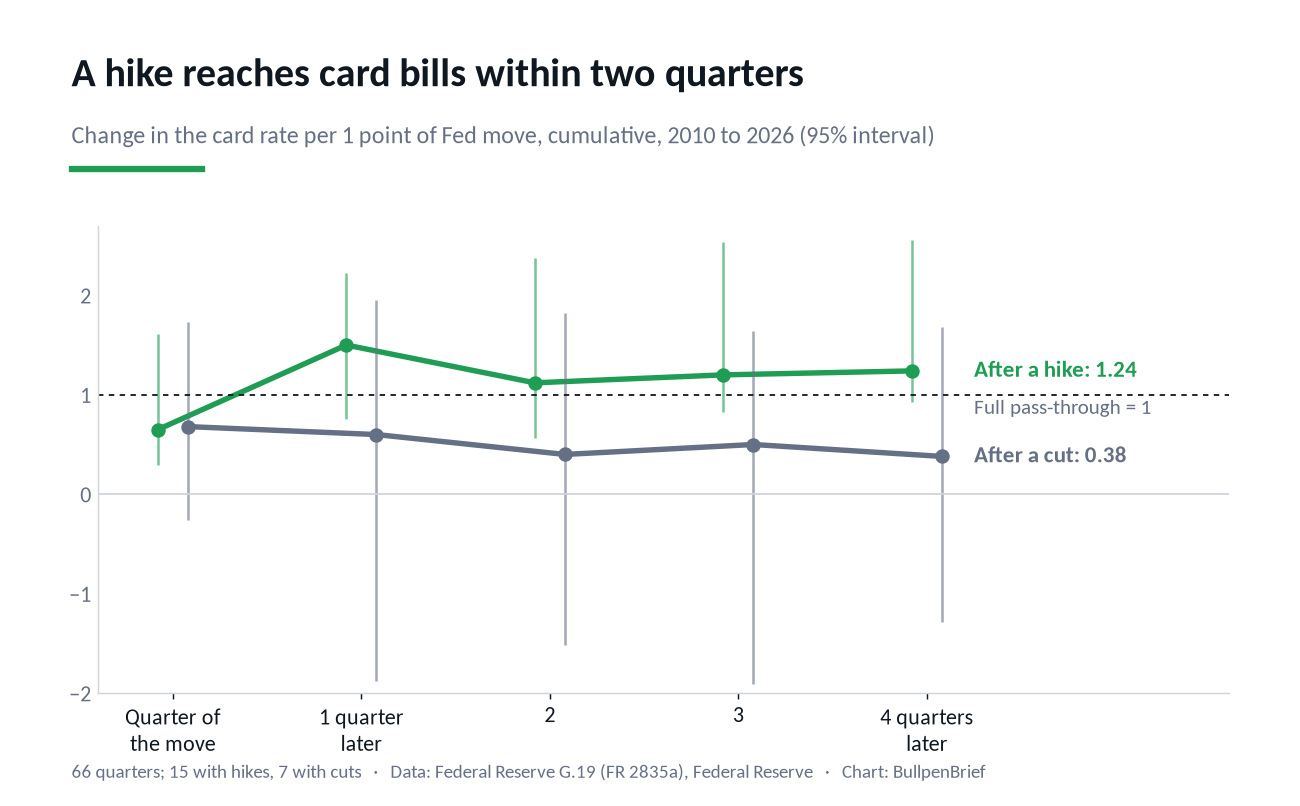
For cuts the estimate starts at a similar 0.68 in the quarter of the move and fades to 0.38 a year later. Here we have to be careful. There were only seven quarters with Fed cuts after 2010, so the interval runs from minus 1.28 to plus 1.68, and we cannot say from this model alone that cuts pass through less than hikes. What we can say is that every big cutting cycle in the data ended with card rates down by less than the Fed, and the gap test above, which uses all 123 quarters, points the same way.
The result does not hang on one cycle. Leaving out 2020 and 2021, the year-on estimates for 2010 onward are 1.26 for hikes and 0.38 for cuts; leaving out 2022 and 2023, 1.93 and 0.26; leaving out 2024 to 2026, 1.20 and 0.13. Using the Fed’s other series, the rate on all accounts including those at 0% promotional rates, gives 1.29 and 0.21.
For the Fed decisions themselves, the latest survey is from August 2026. On September 16, 2026 the Fed raised its target range by a quarter point to 3.75% to 4.00%, which takes the prime rate to 7.00%. On the pattern since 2010, most of that will be on card statements by the next reading. This study looks at what card rates do after the Fed acts, not before. Our study of Fed cuts and mortgage rates found that mortgages move ahead of the decision because they follow bond markets; card rates are tied to prime, which only changes when the Fed acts, so the timing question for cards is how fast they follow, not how far ahead they move.
What this is not
This is not a finding that issuers simply pocket the difference. The rate in the survey is an average across banks and borrowers. When the Fed cuts, it is often because the economy is weakening, and issuers then expect more defaults and price for them. Who carries a balance also changes: if more lower-score borrowers revolve, the average rate rises even if no one’s card is repriced. Our data cannot separate these from a plain increase in margins. The Consumer Financial Protection Bureau reported in 2024 that average card margins over prime had reached an all-time high, which fits what we see.
It is not about your card either. Your rate is set by your card agreement, usually prime plus a fixed margin, and a variable-rate card will follow the prime rate down after a cut on the next billing cycle. The averages here move less because issuers change margins on new accounts, close or reprice old ones, and because the mix of borrowers changes. And it is not a forecast: since 2010 there have been only two big hiking cycles and two big cutting cycles, which is why our intervals are wide.
Download the data (CSV)
credit-card-rates-fed-1994-2026.csv: one row per quarterly reading of the Federal Reserve credit card rate survey, November 1994 to August 2026 (128 rows). Columns: survey month, quarter, average rate on accounts assessed interest, average rate on all accounts, Fed funds target (upper bound) on the first day of the survey month, implied prime rate, card rate minus prime, quarter-on-quarter change in the card rate and in the Fed target, and Fed decisions in the three months before the survey month. Free to use and cite under CC BY 4.0 with attribution to BullpenBrief and a link to this page.
Methodology
Card rates come from the Federal Reserve’s G.19 Consumer Credit release, which publishes results of the Quarterly Report of Credit Card Interest Rates (FR 2835a) filed by a panel of the largest card-issuing banks and a sample of smaller ones. Our main series is the average rate on accounts assessed interest, which covers cardholders who carry a balance, weighted by balances. We also ran everything on the rate for all accounts. Readings are quarterly from November 1994 to August 2026, dated the middle month of each quarter: February, May, August and November.
The Fed target comes from the Federal Reserve’s open market operations tables. For target ranges we used the upper bound, which is the basis for the prime rate (upper bound plus 3 points). For each reading we took the target in force on the first day of the survey month, so a decision made during that month counts toward the next reading. That gives 88 target changes from August 1994 to September 2026.
The survey has a seasonal pattern: in quarters with no Fed move, the card rate rose 0.38 points on average into August and fell 0.29 points into November. The timing model regresses the quarterly change in the card rate on the Fed change in that quarter and the four before, separately for increases and decreases, with a dummy for each survey month instead of a constant. The gap test compares the seasonally adjusted change in the card rate minus the change in the prime rate across quarters near cuts (a cut in that quarter or the two before), near hikes and with no move in the three-quarter window. Confidence intervals are 95% intervals from a circular block bootstrap with blocks of eight quarters, because neighbouring quarters in the same cycle are not independent. Cycles are runs of moves in one direction with gaps of less than 400 days; the cycle comparison uses the last reading before the first move and the latest reading in the same quarter of the year that comes before the next cycle starts and at most four quarters after the first reading following the last move. The 1994 to 1995 hiking cycle started before the first reading and is left out of the cycle comparison. Figures, charts and the method are free to cite with attribution to BullpenBrief.