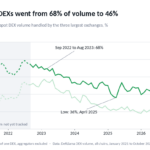



Decentralized exchanges are often described as a market that Uniswap and a couple of rivals have locked up. The volume data say the opposite. We measured every month of DefiLlama’s DEX volume since 2021 and found that the three largest exchanges handled 68.5% of spot DEX volume between September 2022 and August 2023, and 45.9% over the last twelve months (November 2025 to October 2026). Uniswap alone went from 50.9% to 23.9%.
So is concentration rising again? Not in a way the data can confirm. The top 3 share bottomed at 36% in April 2025 and was 51% in October 2026, but month to month it swings by several points, and the last twelve months are statistically level with the twelve before.
Key findings
- The three largest decentralized exchanges handled 45.9% of spot DEX volume from November 2025 to October 2026, down from 68.5% between September 2022 and August 2023, a drop of 22.6 points (95% interval 19.1 to 27.0; DefiLlama, all chains, 813 exchanges).
- Uniswap’s share of all spot DEX volume fell from 50.9% (September 2022 to August 2023) to 23.9% (November 2025 to October 2026), though it was still the largest DEX in 48 of those 50 months.
- DEX concentration has stopped falling but is not clearly rising: the top 3 share bottomed at 36.1% in April 2025, and its trend since then, +2.6 points a year, has a 95% interval of -1.6 to +6.3 (DefiLlama, monthly data to October 2026).
- Within each chain DEX trading is still concentrated: over November 2025 to October 2026 the top 3 exchanges held 95% of DEX volume on BNB Chain, 92% on Base, 89% on Arbitrum and 82% on Ethereum, but only 50% on Solana.
- Ethereum’s share of all DEX volume fell from 59% (September 2022 to August 2023) to 18% (November 2025 to October 2026), while Solana’s rose from 2% to 32% and Base, launched in August 2023, reached 12%.
- Caveat: Spot DEXs only: perpetual futures, aggregators and launchpads are excluded. DefiLlama added Curve, Raydium and MDEX late, so 2021 is not comparable and the baseline starts in September 2022. One wash-trading spike (Mangrove, May and June 2024) was removed; other wash trading cannot be seen in the data.
From three big exchanges to ten
We added up daily volume for every spot DEX DefiLlama tracks on every chain, $13.5 trillion across 813 exchanges from January 2021 to October 2026, and counted each exchange once, with all its versions together (Uniswap V2, V3 and V4 are one Uniswap). DEX aggregators such as 1inch are left out, because their trades are already counted at the exchange they route to.
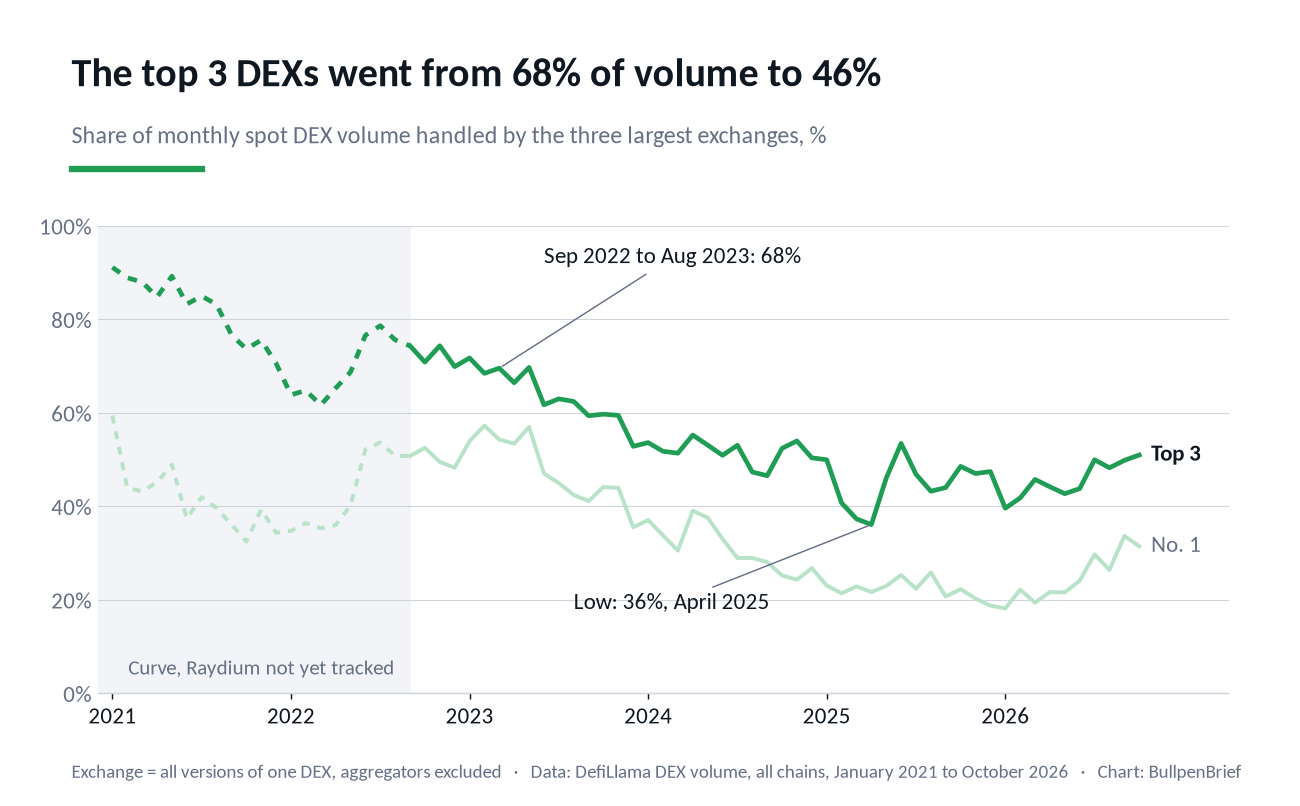
The decline is steady. From September 2022 to April 2025 the top 3 share fell by about 12.7 points a year (95% interval 10.9 to 14.5). Comparing the first and the last twelve-month windows, the drop is 22.6 points (interval 19.1 to 27.0). Another way to see it: the market used to behave as if it had 3.6 equally sized exchanges, and now it behaves as if it had 10.5. That is the inverse of the Herfindahl index, a standard concentration measure.
The leader did not change. Uniswap was the largest DEX in 48 of the 50 months since September 2022; Raydium beat it in January 2025, during the memecoin rush on Solana, and PancakeSwap in December 2025. What changed is how much of the market the leader holds. The other two seats are up for grabs: Curve and PancakeSwap held them in 2022 and 2023, while in the last year PancakeSwap, PumpSwap, Aerodrome and HumidiFi rotated through them.
Each chain still has a champion
The market did not fragment because Uniswap got beaten on its home turf. On Ethereum the top 3 still handle 82% of DEX volume, and Uniswap alone 57%. On BNB Chain the top 3 hold 95%, up from 86% in our base period, with PancakeSwap at 73%. On Base, Aerodrome and two others hold 92%. On Arbitrum, 89%.
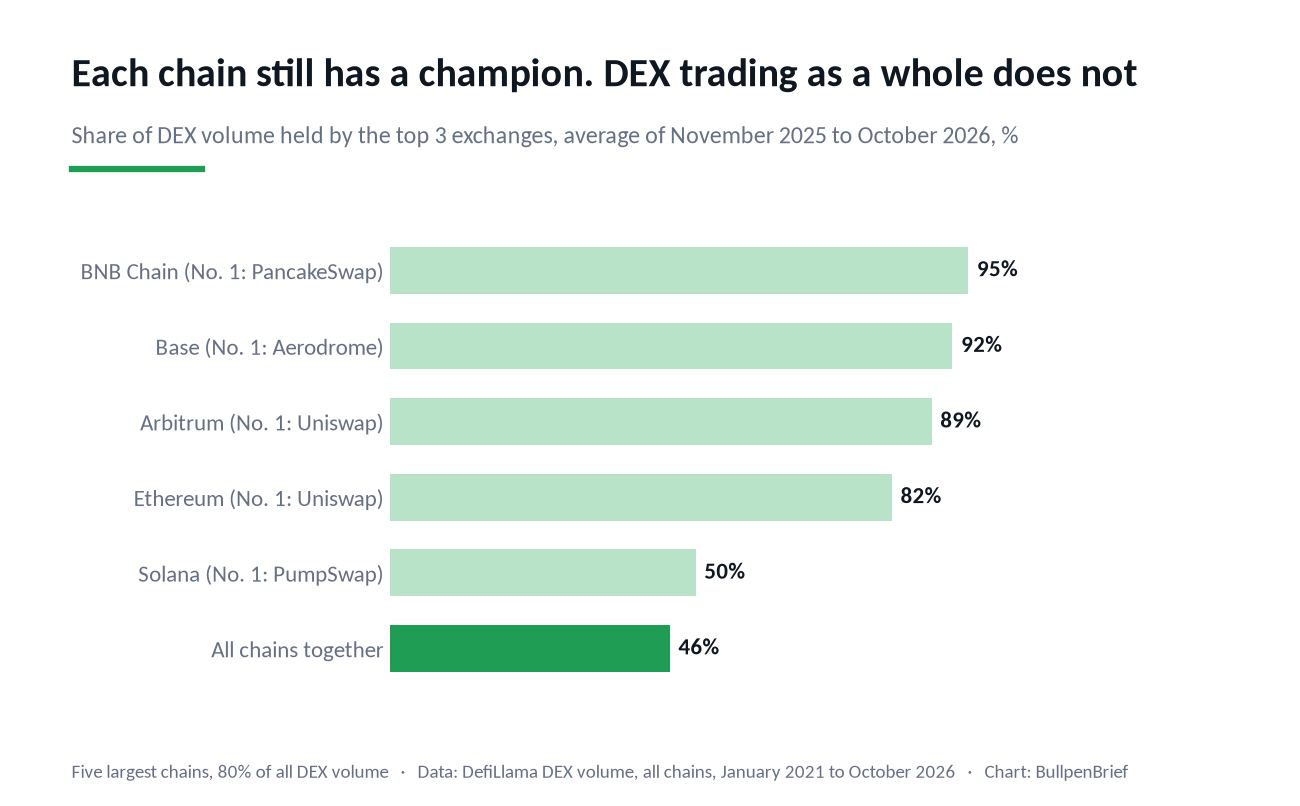
Weighted by volume, the leading DEX on each of the five largest chains holds 47% of its chain’s trading. The largest DEX across all chains holds 24% of the total. The gap between those two numbers is the story: crypto spread over more chains, and each chain grew its own dominant exchange.
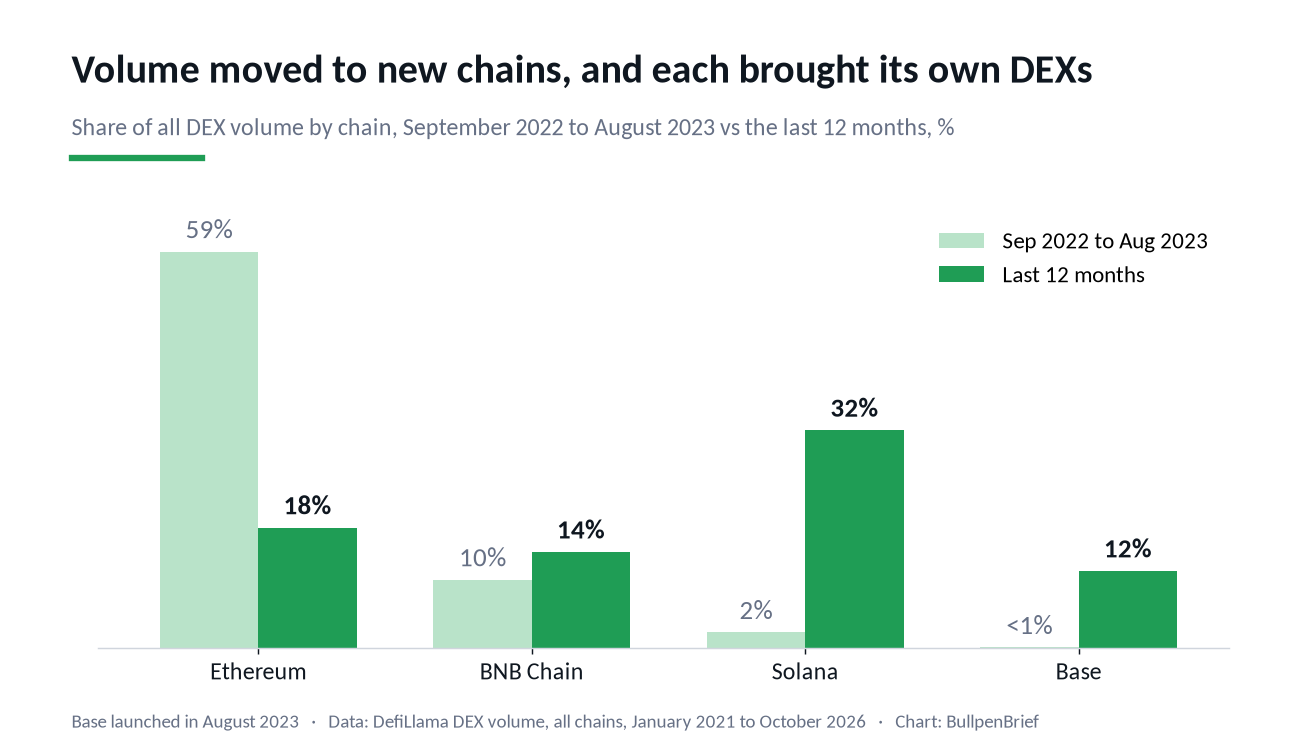
Ethereum’s share of all DEX volume fell from 59% to 18%. Solana went from 2% to 32%, and Base, which launched in August 2023, now has 12%. Solana is the one chain where real competition shows up inside the chain: its top 3 share fell from 83% to 50%, by about 11.7 points a year (interval 8.9 to 14.3). PumpSwap led Solana in 10 of the last 12 months with 21% of its volume, and the rest is split among HumidiFi (12%), Orca, Meteora, BisonFi and Raydium (9% to 10% each) and a long tail. HumidiFi and BisonFi are proprietary AMMs, run by a single market maker, a model that barely existed on Solana two years ago.
Is it rising again?
Since May 2025 the top 3 share has moved between 39.6% and 53.4%, and October 2026, at 50.9%, was the highest month since June 2025. That looks like a turn, but the evidence is weak. The trend since the April 2025 low is +2.6 points a year with an interval of -1.6 to +6.3, which includes zero. The average of the last twelve months, 45.9%, is 0.1 points above the twelve before (interval -3.9 to +4.9).
Counting only the 20 largest exchanges, which removes the effect of DefiLlama adding small DEXs over time, the top 3 have regained a little: +4.6 points a year since April 2025 (interval 0.3 to 8.5). Counted by individual contract version instead of by exchange, the top 3 share kept falling over the last two years (-5.1 points a year, interval -7.9 to -1.7), as Uniswap V4 split volume with V3 and V2 rather than replacing them. Our reading: concentration stopped falling in 2025, and it is too early to call a reversal.
What this is not
This is spot trading on DEXs only. Perpetual futures exchanges such as Hyperliquid, centralized exchanges, aggregators and launchpads like pump.fun’s bonding curve are not in the numbers.
Volume is not fairness or safety. A less concentrated market can still route most trades through a few market makers or a few aggregators, and some DEX volume is bots trading with themselves. We removed one clear case, Mangrove in May and June 2024, when it reported 43% of all DEX volume in a single month, more than 8,000 times its usual level. Other wash trading we cannot see.
The 2021 numbers on the chart are not comparable. DefiLlama started tracking MDEX in November 2021 and Curve and Raydium in August 2022, though all three were large well before. Without them, 2021 looks more concentrated than it was (82% for the top 3), which is why we compare from September 2022, the first month with all three in the data. Meteora’s DLMM pools are tracked only from January 2025, so 2024 is slightly overstated as well; Meteora was never in the top 3, so the effect is small.
Download the data (CSV)
dex-volume-concentration-2021-2026.csv: one row per month of spot DEX volume across all chains tracked by DefiLlama, January 2021 to October 2026 (70 rows). Columns: month, total DEX volume (USD billions), number of exchanges with volume, share of the top 1, 3 and 5 exchanges, Herfindahl index, effective number of exchanges, top 3 share by contract version, top 3 share within the 20 largest, and the three largest exchanges with their shares. Free to use and cite under CC BY 4.0 with attribution to BullpenBrief and a link to this page.
Methodology
Data come from DefiLlama’s DEX volume overview (daily volume per protocol, all chains and separately for Ethereum, Solana, BNB Chain, Base and Arbitrum), downloaded November 2, 2026, and its list of parent protocols for exchange names. We kept protocols in DefiLlama’s “Dexs” category, which leaves out aggregators, interfaces, prediction markets and launchpads, summed daily volume by calendar month from January 2021 to October 2026 (70 months; November 2026 is incomplete) and grouped versions under their parent protocol. That gives 1,032 DEX versions belonging to 813 exchanges.
For each month we computed the share of the largest one, three and five exchanges, the Herfindahl index and its inverse. A protocol month was dropped if it was more than 3% of the month’s volume and more than 100 times that protocol’s median over the six months before and after; only Mangrove in May and June 2024 met the rule. Trends are least squares slopes on monthly values; their 95% intervals come from a block bootstrap of residuals in six month blocks, because neighboring months are correlated. Differences between twelve-month windows use a block bootstrap in three month blocks. Per-chain figures use the same method on each chain’s own data. Figures, charts and the method are free to cite with attribution to BullpenBrief.