








I remember the autumn of 2001. I was a junior analyst on a trading desk, and the air in the building had that specific sour mix of fear and denial. The internals were screaming long before the headlines caught up. Company executives, the people who actually ran the businesses, were selling their own stock at a pace that should have made everyone stop. Most people didn’t. They got crushed. That same signal is flashing again today, and it’s louder than it’s been in over two decades.
Corporate insiders, CEOs, CFOs, directors, the ones who know the P&L line by line, haven’t been this bearish since the dot-com bust. The sell-to-buy ratio among insiders has blown past levels that historically preceded major drawdowns. According to data compiled by the Wall Street Journal and Vickers Stock Research, the ratio is now hovering around 10-to-1. That means for every one insider buying their own company’s stock, ten are selling. In a healthy bull market, you’d expect that ratio to hover around 2-to-1 or 3-to-1. This is not healthy. This is a signal.
And it’s not just a few names. The selling is broad-based, spanning tech, industrials, consumer discretionary, and even financials. When the people running the company are voting with their portfolio, it’s worth listening.
The Data Is Ugly, And It’s Not Just Seasonal Window Dressing
Every December, there’s a predictable uptick in insider selling as executives cash out stock grants for tax planning. That’s normal. What’s happening now is not normal. The selling started accelerating in late September and has not let up. The volume of shares sold in October alone exceeded the total for the entire third quarter in some sectors.
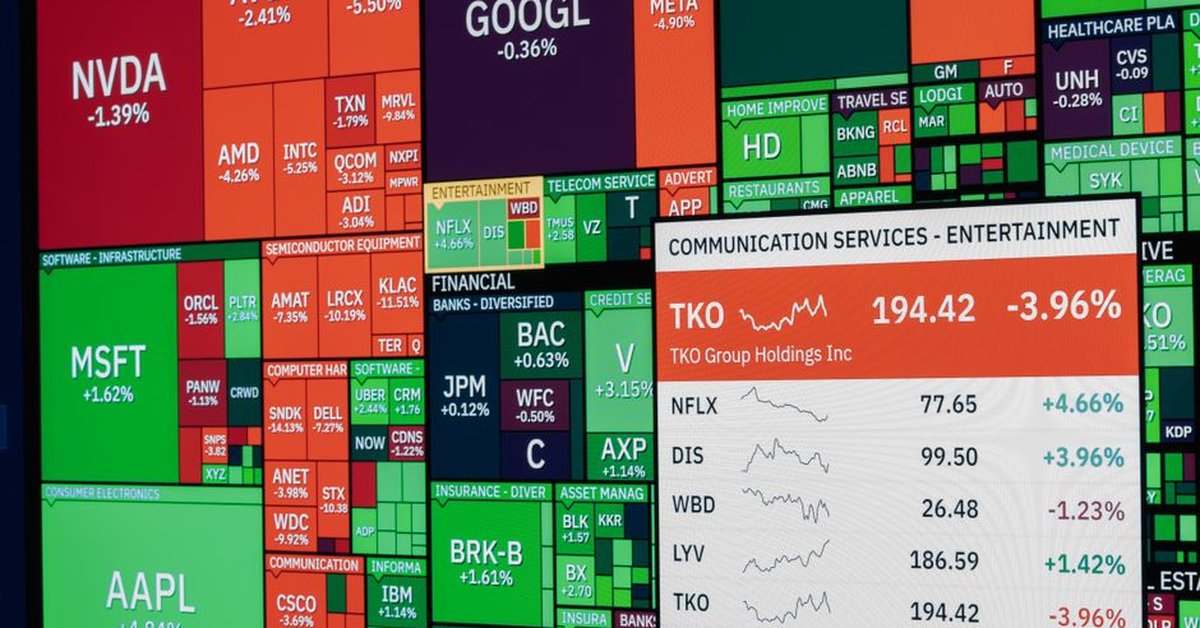
Look at the technology space. The mega-cap names, the ones everyone piles into as safe havens, are seeing their founders and top brass lighten up. It’s not panic selling, but it’s methodical. Consistent. The kind of selling that says ‘I’ve got a good price here, and I’m not sure I’ll get a better one.’
Meanwhile, the broader market narrative is still optimistic. The Fed is signaling cuts. Earnings have been okay. But insiders are acting like they know something the algos don’t. And historically, they usually do. A 2020 study from the University of Chicago found that insider trading signals, when aggregated, predicted future stock returns with a statistically significant edge over a 12-month horizon. The last time this ratio was this extreme was early 2001, just before the Nasdaq shed another 30%.
What This Means for the Retail Investor Standing in the Rain
For the average person managing a 401(k) or a self-directed account, this signal is a yellow flag, not a red one, not yet. But it’s a warning that the risk/reward profile of this market has shifted. The smart money is taking chips off the table. That doesn’t mean you should sell everything and go to cash. It means you should be asking hard questions about your exposure.
Are you overweight in the same high-multiple tech names that insiders are selling? Do you have a plan for a 10-15% correction that comes without warning? Because those are the corrections that hurt the most, the ones nobody sees coming because the headlines are still friendly.
The recent volatility in crypto markets, where $286 million in leveraged bets got vaporized in a single whipsaw, is a reminder that leverage cuts both ways. The equity market isn’t as levered as crypto, but margin debt is still elevated. When insiders are selling, and the crowd is still buying, the crowd usually ends up holding the bag.
History Repeats, But the Details Change
The dot-com bubble, the 2007 housing peak, even the 2018 Q4 selloff, all of them were preceded by insider selling that spiked well above normal levels. In 2007, the ratio hit 8-to-1 before the subprime crisis. In 2018, it hit 6-to-1 before the market dropped 20% in three months. We’re now at 10-to-1. That’s not a guarantee of a crash, but it’s a powerful statistical warning.
And here’s what makes this cycle different: the government’s role in the market. With the Fed holding rates high and the Treasury issuing debt like there’s no tomorrow, liquidity conditions are tighter than they appear. The regulatory environment is shifting fast, especially in tech and AI, where the hands-off era is ending. That introduces a layer of uncertainty that insiders are clearly pricing in.
So what do you do? First, check insider trading data for the stocks you own. It’s public. Sites like OpenInsider or SEC filings on EDGAR are free. If the CEO of your biggest holding has been selling steadily for three months, that’s a conversation worth having with yourself. Second, consider trimming positions that have run up hard and where insiders are the most aggressive sellers. You don’t have to be a hero. You just need to not be the last one out.
My read: this signal is real, it’s broad, and it’s been building for weeks. The market can stay irrational longer than you can stay solvent, as Keynes said. But the people inside the building are already heading for the exits. I’m paying attention.
Frequently Asked Questions
- What is the insider sell-to-buy ratio and why does it matter?
The sell-to-buy ratio compares the number of insider stock sales to insider purchases. A high ratio, like the current 10-to-1, indicates that corporate executives are selling far more than buying. Historically, extreme readings have preceded market downturns. - Should I sell all my stocks if insiders are selling?
Not necessarily. Insider selling is a warning signal, not a sell-all trigger. It suggests the risk/reward is less favorable. The best response is to review your holdings, especially those where insiders are heavy sellers, and consider rebalancing or setting tighter stop-losses. - Where can I check insider trading data for free?
You can access insider trading filings through the SEC’s EDGAR system (sec.gov/cgi-bin/srch-edgar) or aggregator sites like OpenInsider.com. These platforms compile Form 4 filings that show insider transactions within two business days.