


“Hits 52-week high” is one of the most common stock headlines, and readers take it two opposite ways: strength attracts more buyers, or the easy money has been made. We checked what happened next. Since 1996, stocks in today’s S&P 1500 made a fresh 52-week closing high 46,310 times. Over the following 12 months, 48.5% of them beat the S&P 500. The same stocks on random ordinary days beat it 50.6% of the time. A new high told you almost nothing.
It was not a top either. Only 2.5% of new highs were never surpassed in the following year, about the same as the 2.1% for an ordinary day.
Key findings
- Of 44,166 fresh 52-week closing highs by stocks now in the S&P 1500 from 1996 to October 2025, 48.5% beat the S&P 500 over the next 12 months with dividends, against 50.6% for the same stocks on random ordinary days (gap 0.5 to 3.8 points, 95% interval; Yahoo Finance prices).
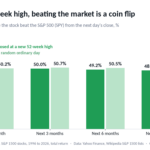
- Over the next one and three months after a new 52-week high, S&P 1500 stocks beat the S&P 500 49.6% and 50.0% of the time, statistically the same as the 50.2% and 50.7% on ordinary days of the same stocks (46,231 and 45,947 new highs, 1996 to 2026).
- Only 2.5% of 44,167 new 52-week highs at S&P 1500 stocks since 1996 were never surpassed within the following 12 months, close to 2.1% for ordinary days of the same stocks.
- In the year after a new 52-week high, 34.7% of S&P 1500 stocks dropped 20% or more below the high’s close at some point, against 36.6% after an ordinary day of the same stock (44,167 cases, 1996 to 2025).
- New 52-week highs from 2016 to October 2025 beat the S&P 500 over the next year 42.9% of the time against 46.0% for ordinary days; from 1996 to 2007 the figures were 53.8% and 54.4%.
- Caveat: only companies still in the S&P 1500 today plus former S&P 500 members that still trade are counted, so failed and acquired companies are missing; this flatters returns after any day, and the comparison with ordinary days of the same stocks cancels most but not all of it.
After a new high, beating the market is a coin flip
For each new high we bought at the next day’s close, since the high is only known after the market shuts, and measured the total return with dividends against the S&P 500 ETF (SPY). The comparison is the same stock on three random days that were not new highs. That way the company, its sector and its size are the same, and the only difference is whether the stock had just hit its high.
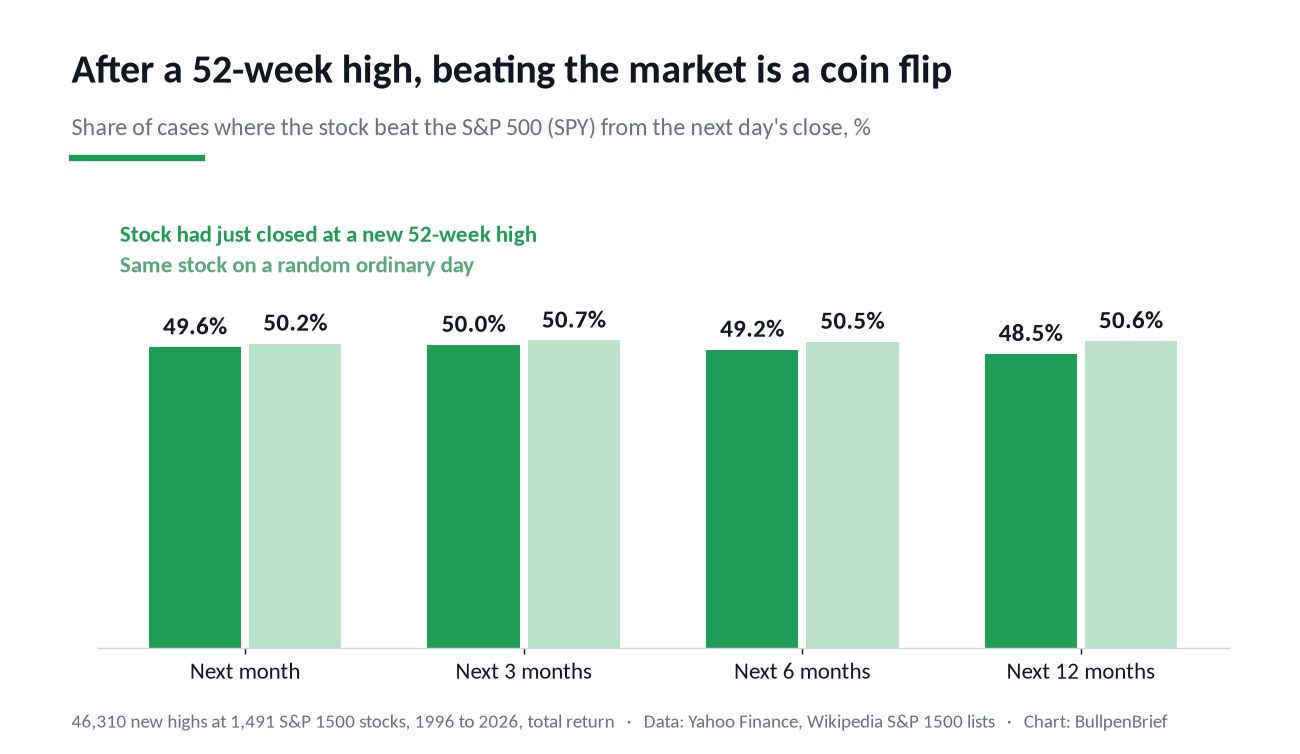
Over the next month, 49.6% of new highs beat the index, against 50.2% for ordinary days. Over three months, 50.0% against 50.7%. Neither gap can be told apart from zero. Over 12 months the new highs did slightly worse: 48.5% against 50.6%, a gap of 2.1 points with a 95% interval of 0.5 to 3.8 points (44,166 new highs at least a year old). The median stock gained 10.4% in the year after a new high, against 12.2% after an ordinary day; relative to SPY, the median was 1.0 point behind against 0.4 points ahead.
That small lag is fragile. When we counted only new highs that came after three months without one, a stricter definition of a breakout (23,664 cases), the 12-month figures were 48.8% against 49.9%, and the interval of the gap included zero. Leaving out the biggest 1% of winners and losers on each side, the average 12-month result relative to SPY was +1.7 points after a new high and +2.9 after an ordinary day.
A new high is rarely the top
The other fear is buying the exact peak. It almost never happens. Of the 44,167 new highs at least a year old, 97.5% were followed by a higher close within 12 months.
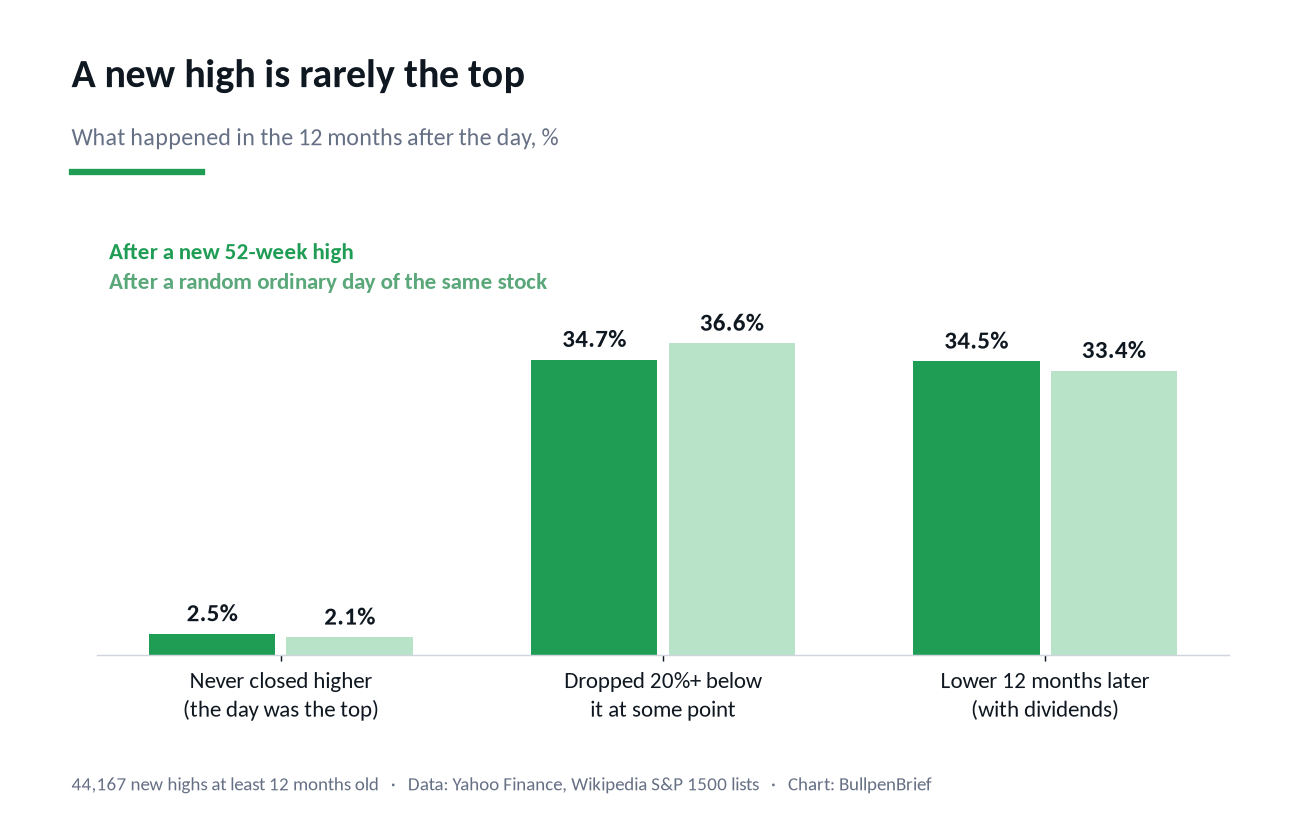
That does not make the high a safe entry. In 34.7% of cases the stock dropped 20% or more below its new-high price at some point in the next year, and 34.5% were lower a year later even with dividends. But a random day of the same stock carried the same risk: 36.6% saw a 20% drop and 33.4% were lower a year later. The day of a new high is about as risky as any other day to buy that stock, no more and no less.
All-time highs, not just 52-week highs, did not change the picture: of 22,050 cases where the stock closed above every price since 1995 or its listing, 47.8% beat the S&P 500 over the next year, and the gap to ordinary days was again within the noise. Neither did the market backdrop. When the S&P 500 itself was within 5% of its 52-week high, 47.5% of new highs beat it over the next year against 48.7% for ordinary days; when the market was further down, 52.9% against 54.1%.
Since 2008, new highs have lagged slightly
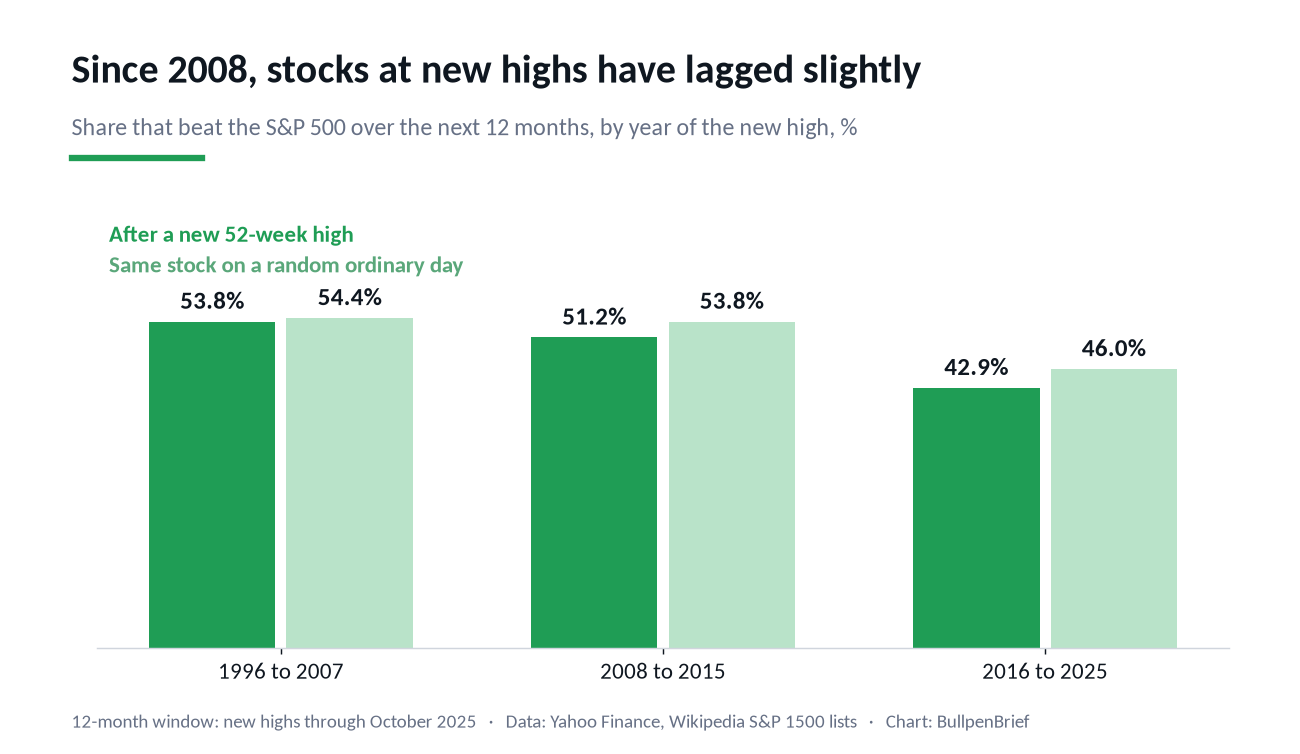
From 1996 to 2007, new highs beat the index over the next year 53.8% of the time and ordinary days 54.4%, no difference. From 2008 to 2015 it was 51.2% against 53.8%, and for new highs from 2016 to October 2025, 42.9% against 46.0%. In both later periods the gap, about 3 points, is real by our intervals but small. The low levels after 2016 for both groups reflect a market led by a few giant companies: most stocks trailed the S&P 500 whatever day you bought them.
Size followed the same pattern. New highs at current S&P 500 companies beat the index over the next year 52.4% of the time against 54.3% for ordinary days, at S&P 400 companies 47.3% against 49.9%, at S&P 600 companies 44.3% against 46.5%.
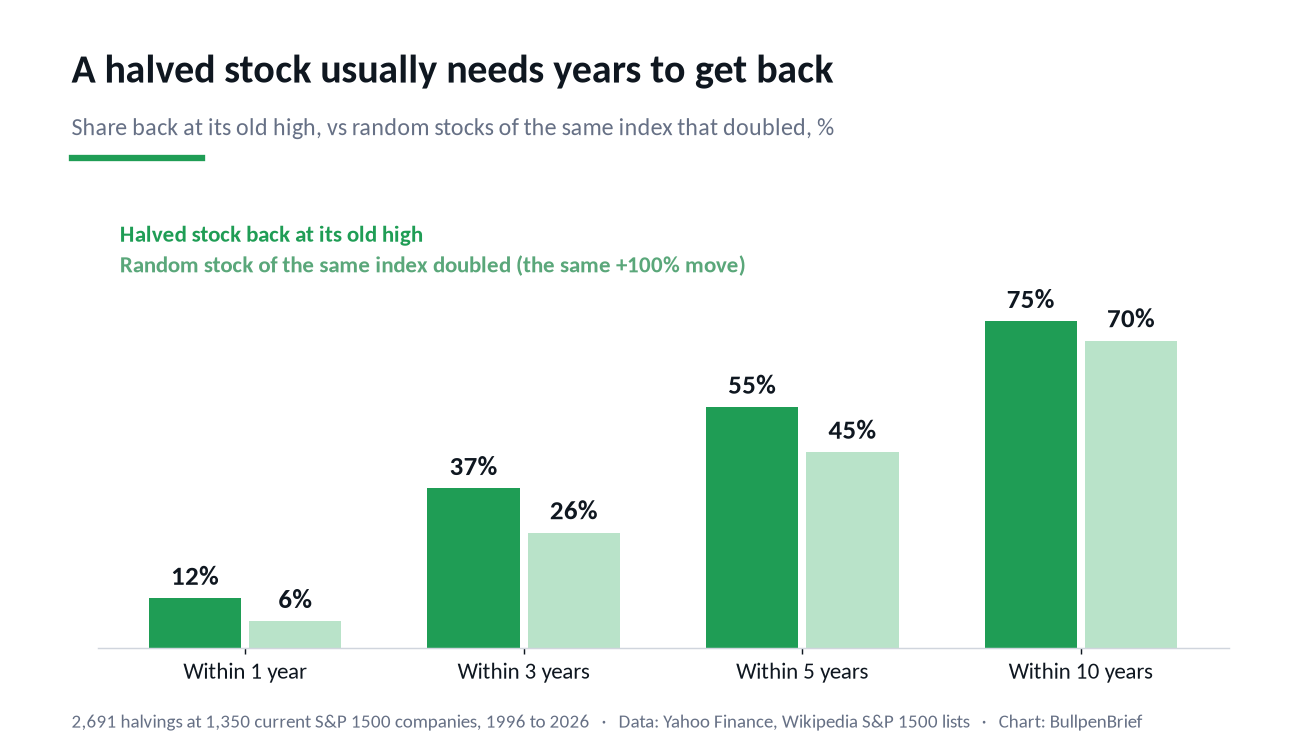
This connects to our earlier study of the opposite situation, stocks that halve from their high. That one asked how long a crashed stock takes to recover. This one asks whether a stock at the top of its range keeps going. In both cases the stock’s recent path predicts less than the stories around it suggest.
What this is not
This is not a test of momentum strategies. Academic work, starting with George and Hwang in 2004, ranks stocks by how close they are to their 52-week high and holds a portfolio of the closest against the furthest. We asked a simpler question that matches the headline: a stock just made a new high, what happens if you buy it. Our answer is about that single day, not about a ranked portfolio rebalanced every month.
It is also not free of survivorship. Every company here is still in the S&P 1500 today, or is one of 11 former S&P 500 members with new highs in our data that still trade. Companies that hit a high and later failed or were bought out are missing, which flatters the returns after every day, new high or not. The comparison with ordinary days of the same stocks cancels most of that, because both sides share the same survivors, but the absolute returns should not be read as typical for all stocks. And these are close-to-close prices without trading costs or taxes.
Download the data (CSV)
new-52-week-highs-1996-2026.csv: one row per new 52-week closing high (after at least 21 trading days without one) by a stock now in the S&P 1500 or a former S&P 500 member that still trades, January 1996 to October 2026 (46,310 rows). Columns: date, ticker, company, index group, close, whether it was also an all-time high since 1995, whether the S&P 500 was within 5% of its own 52-week high, total return over 1, 3, 6 and 12 months from the next day’s close, the same minus SPY, whether the stock never closed higher within 12 months, and the lowest close in that year relative to the high. Free to use and cite under CC BY 4.0 with attribution to BullpenBrief and a link to this page.
Methodology
The universe is the current S&P 500, S&P 400 and S&P 600 from Wikipedia’s constituent lists, plus companies removed from the S&P 500 since 2007 that still trade, from Wikipedia’s S&P 500 change table. Daily closes from Yahoo Finance, adjusted for splits (for the high) and for dividends (for returns), run from January 1995 to October 13, 2026; 1,491 companies produced at least one new high.
A new 52-week high is a close above every close of the previous 252 trading days, with at least 252 days of history, a price of $5 or more and no gap of more than ten days in the quotes. To avoid counting a trending stock dozens of times, a new high counts only if the stock had made no new high in the previous 21 trading days; the robustness check uses 63 days. We dropped 175 new highs reached with a one-day gain of 30% or more while the S&P 500 moved less than 3%, which are mostly buyouts or data errors. That leaves 46,310 new highs from January 1996 to October 2026.
Returns run from the close of the day after the new high, over 21, 63, 126 and 252 trading days, with dividends reinvested, minus the same-period return of SPY. The control is three random days of the same stock that met the same history and price rules and were not new highs, 138,930 days in all. “Never closed higher” means no close in the next 252 trading days above the close on the day of the high; “dropped 20%” means at least one close in that year 20% or more below it. Confidence intervals are 95% bootstrap intervals that resample whole calendar years, because new highs come in waves with the market and are not independent. The single largest 12-month result (Telephone and Data Systems, July 2004) accounts for 0.7% of all positive results, so no single case drives the averages. Figures, charts and the method are free to cite with attribution to BullpenBrief.