


Car insurance has a reputation for getting more expensive every year, and the official numbers mostly back it up. We compared the government’s price index for car insurance with overall inflation for every year since it began in 1968. In 41 of 57 years from 1969 to 2025, car insurance prices rose faster than prices in general, by 2.0 percentage points a year on average. Since 1990 they have gone up 5.2 times, while overall prices went up 2.6 times.
The record is not one long climb, though. Insurance prices move in multi-year waves, and the latest wave, the steepest since the mid-1970s, has now broken. In August 2026 car insurance cost 5.1% less than a year earlier while overall prices rose 3.4%, the sharpest yearly drop on record outside the pandemic refunds of 2020.
Key findings
- US car insurance prices rose faster than overall inflation in 41 of 57 years from 1969 to 2025, by 2.0 percentage points a year on average (95% interval 0.3 to 3.1), according to BLS consumer price data.
- From December 1989 to December 2025 the US consumer price index for car insurance rose 5.2 times, while all consumer prices rose 2.6 times and medical care 3.8 times (BLS CPI-U).
- The 12-month rise in US car insurance prices peaked at 22.6% in April 2024, the highest since 1976; insurance prices rose 14% in 2022, 20% in 2023 and 11% in 2024 (BLS CPI-U, December to December).
- In August 2026 US car insurance prices were 5.1% lower than a year earlier while overall prices rose 3.4%, the steepest yearly drop on record outside the 2020 pandemic refunds (BLS CPI-U, series since 1968).
- Caveat: the index tracks the price of comparable coverage nationwide, not any one driver’s bill, and yearly figures swing with multi-year insurance cycles, so the intervals are wide. Without 2023 and 2024 insurance still beat inflation in 39 of 55 years.
Faster than inflation, most years
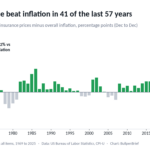
The chart shows, for each year, how much faster or slower car insurance prices rose than the Consumer Price Index as a whole, from December to December. Green bars are years when insurance outpaced inflation.
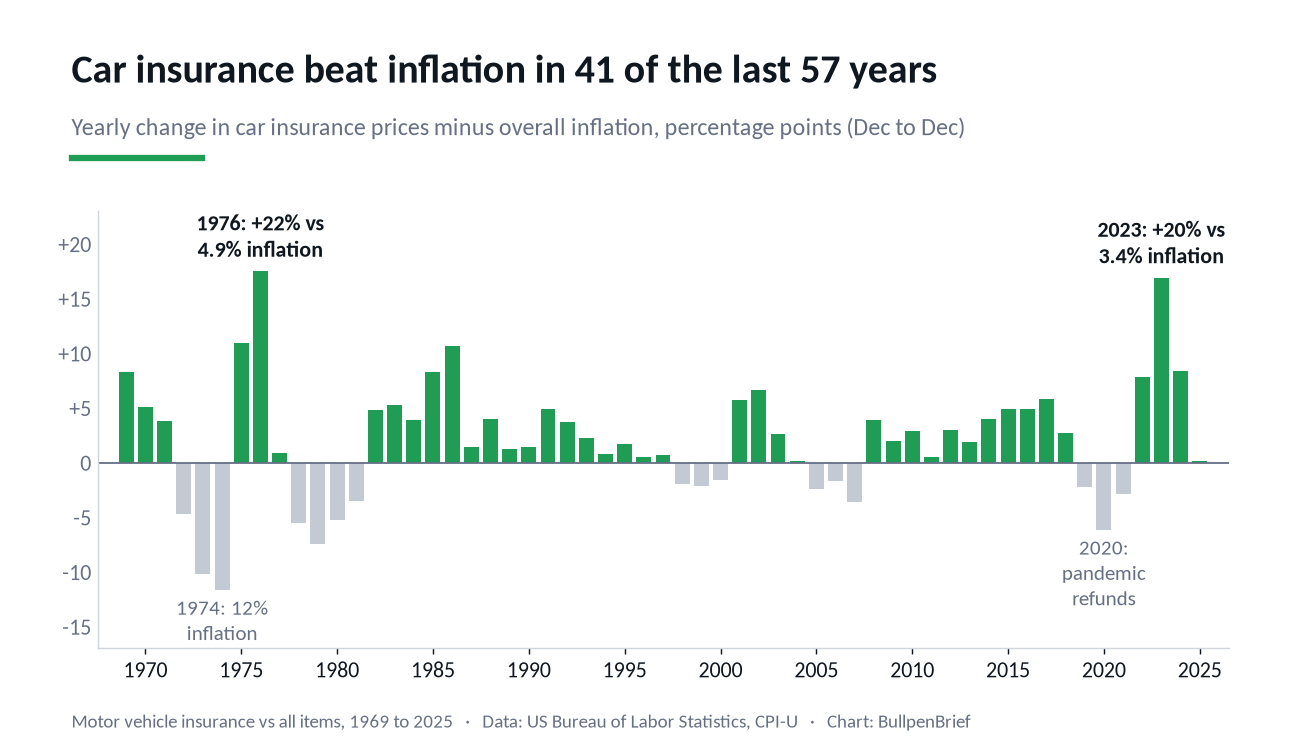
Across all 57 years, insurance beat inflation in 72% of them. Because insurance prices run in streaks, neighbouring years are not independent, so we use a bootstrap that resamples five-year blocks: the 95% interval for that share runs from 54% to 86%, and for the average gap from 0.3 to 3.1 points a year. Since 1990 the picture is the same or slightly stronger: 27 of 36 years (75%), an average gap of 2.1 points (interval 0.5 to 3.0).
Compounded, the gap is large. From December 1989 to December 2025 car insurance prices rose 4.7% a year on average, against 2.7% for all items. In inflation-adjusted terms that is a real increase of about 103%: the same coverage costs roughly twice as much of a typical household’s purchasing power as it did in 1990.
The record is not driven by one bad year. The biggest single year, 1976, accounts for 15% of the total gap; take out the two worst recent years, 2023 and 2024, and insurance still beat inflation in 39 of the remaining 55 years, by 1.6 points a year on average (interval 0.1 to 2.9).
How it compares with other costs
Car insurance is not the only household cost with a habit of outrunning inflation. Medical care, the usual example, beat overall inflation in more years than insurance did, 30 of 36 since 1990 against 27, but by a smaller margin: 1.1 points a year against 2.1. Car repair and maintenance beat it in 24 of 36 years, by 0.9 points. Cars themselves did the opposite: new vehicle prices rose faster than inflation in only 7 of 36 years and used cars in 12, partly because the index adjusts for better equipment and safety features.
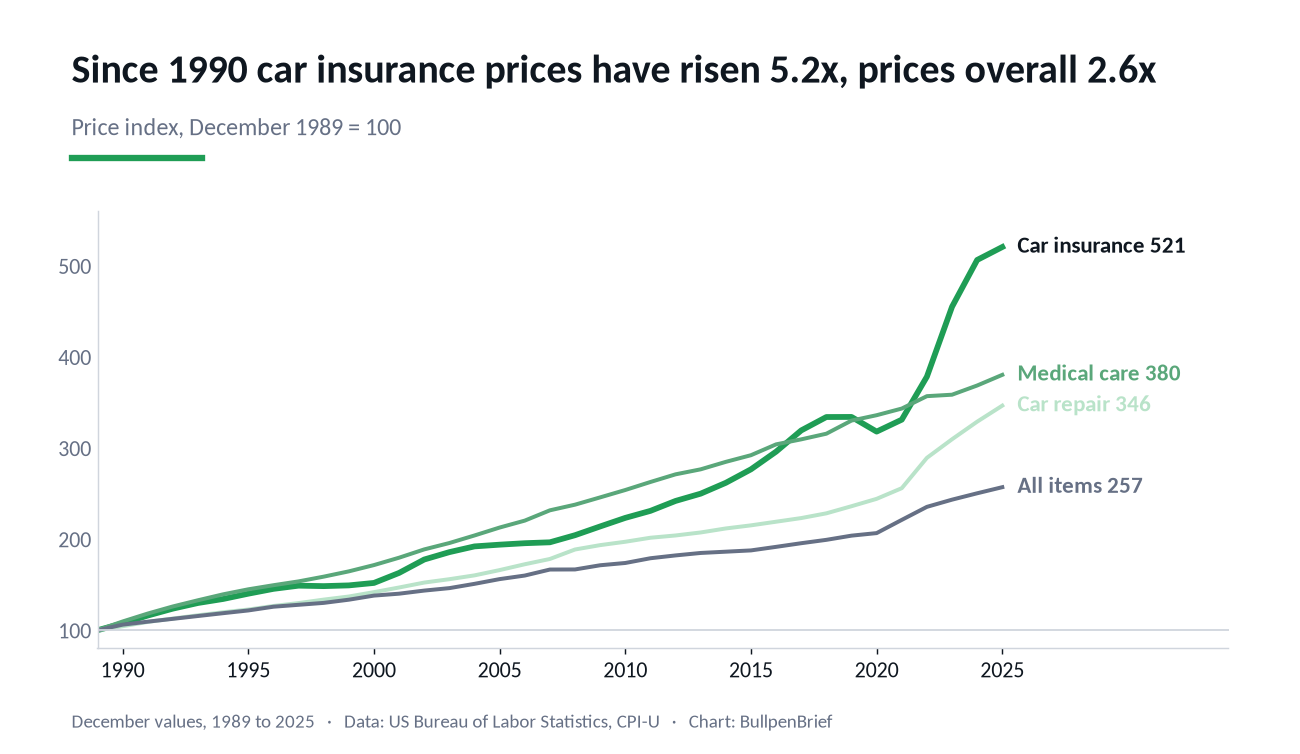
So the cars got relatively cheaper while repairing and insuring them got relatively dearer. Over the full period, car insurance prices rose about 26 times since December 1968 and all items about 9 times.
Which years stand out
Insurance prices go through hard and soft phases, and the streaks are long. From 1982 to 1997 car insurance beat inflation 16 years in a row; from 2008 to 2018, 11 years in a row. The years it lagged cluster in two kinds of periods: high general inflation, when everything else caught up (1972 to 1974 and 1978 to 1981), and the soft insurance markets of 1998 to 2000 and 2005 to 2007. Car insurance prices actually fell over a calendar year only four times: 1972, 1973, 1998 and 2020.
By decade, the average gap was 3.1 points a year in the 1980s, about 1.2 points in the 1990s and 2000s, 2.8 points in the 2010s and 4.0 points in 2020 to 2025. The two largest single-year gaps are half a century apart: 1976, when insurance prices rose 22% against 4.9% inflation, and 2023, when they rose 20% against 3.4%.
The latest wave, and the turn
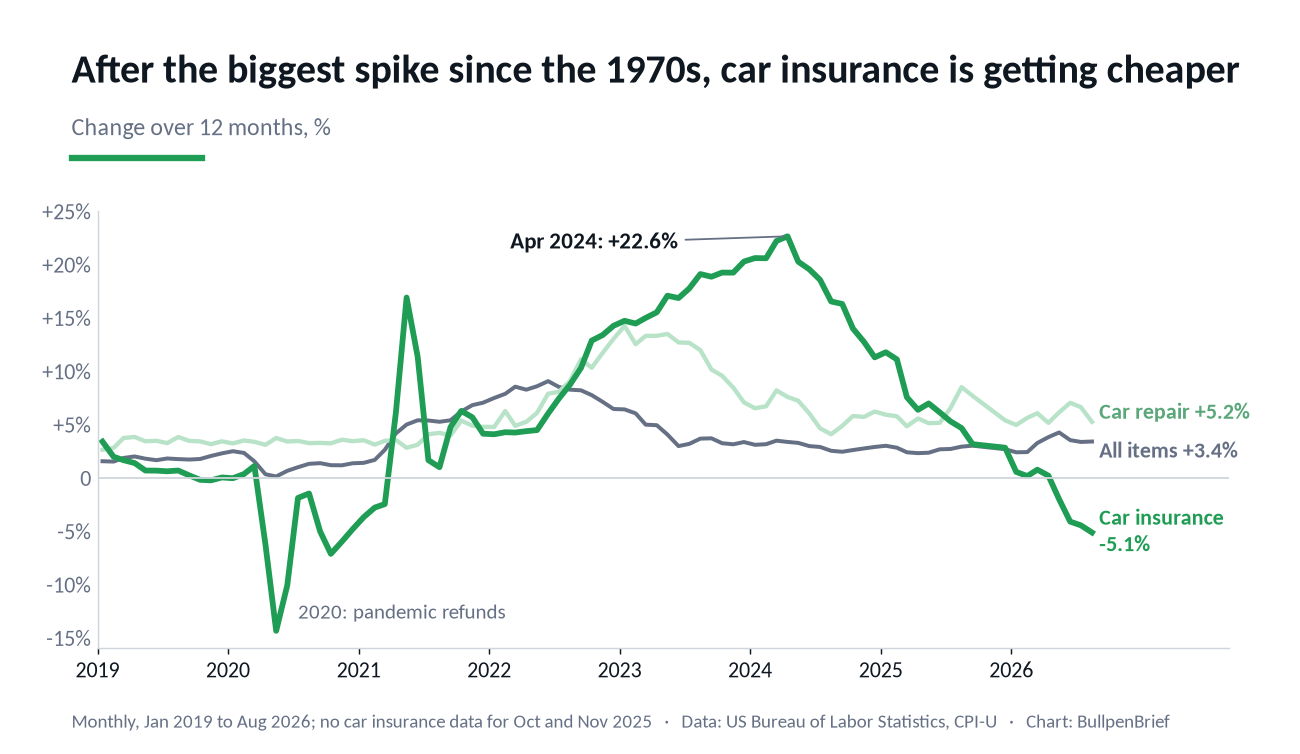
The 2020s wave came in three steps. In 2020 insurers returned premiums to drivers who were barely on the road, which the price index records as a 4.8% drop over the year. In 2021 and 2022 the cost of what insurers pay for rose fast: used car prices, parts and repair labour. Car repair prices were up 14% over the year at their peak in January 2023. Insurance prices followed with a lag, as policies renewed and state regulators approved higher rates: plus 14% in 2022, 20% in 2023 and 11% in 2024. The 12-month rise peaked at 22.6% in April 2024, the highest since 1976.
From January 2021 to August 2026 car insurance prices rose 54% in total, against 28% for overall prices and 50% for car repair. By 2025 the gap with inflation had shrunk to almost nothing, 2.8% against 2.7%, and in 2026 prices started falling. The index peaked in February 2026 and by August was 5.5% below that peak. Car repair costs, the main driver of claims, were still rising 5.2% a year in August, so the history here suggests a pause in a long trend, not its end. That is a reading of past cycles, not a forecast.
What this is not
This is not a measure of your premium. The Consumer Price Index tracks the price of comparable coverage for comparable drivers and cars across the country. Your bill also depends on where you live, your record, your car and the coverage you choose, and it rises when you buy a more expensive car to insure. State averages diverge widely, and none of that is in a national index.
It is also not a claim that insurers profit from the gap. Insurance prices follow the cost of claims, which is driven by repair and parts prices, medical bills, litigation, theft and weather. Those costs have outpaced general inflation for decades as cars filled with sensors and electronics. We did not measure insurer margins.
And yearly numbers hide timing. Insurance prices respond to cost spikes with a delay of a year or more, because policies renew every six or twelve months and rate increases often need approval from state regulators. A year in which insurance lagged inflation is often followed by one in which it catches up, which is why we report long-run averages and streaks rather than any single year.
Download the data (CSV)
car-insurance-vs-inflation-1969-2025.csv: one row per year, 1969 to 2025 (57 years), December to December changes. Columns: year, percent change in the CPI for motor vehicle insurance, all items, the gap in percentage points, and percent changes for car repair and maintenance, new vehicles, used cars and trucks and medical care. Free to use and cite under CC BY 4.0 with attribution to BullpenBrief and a link to this page.
Methodology
All data come from the US Bureau of Labor Statistics Consumer Price Index for All Urban Consumers (CPI-U), US city average, not seasonally adjusted, downloaded through the BLS public API. Car insurance is the motor vehicle insurance index (series CUUR0000SETE), which starts in September 1968; overall inflation is the all items index (CUUR0000SA0). For comparison we used motor vehicle maintenance and repair (CUUR0000SETD), new vehicles (CUUR0000SETA01), used cars and trucks (CUUR0000SETA02) and medical care (CUUR0000SAM).
Yearly changes are December to December, 1969 to 2025, 57 years. The gap is the insurance change minus the all items change in percentage points; a year counts as beating inflation if the gap is positive. Confidence intervals are 95% moving-block bootstrap intervals with five-year blocks, because insurance prices move in multi-year cycles. Recent monthly figures are 12-month changes through August 2026, the latest release. BLS did not publish October 2025 data during the federal government shutdown, and the car insurance index is also missing for November 2025; those months are left out. Figures, charts and the method are free to cite with attribution to BullpenBrief.