

2020 and 2021 were the IPO boom years on US exchanges. We checked where that class of stocks stands now. Of 694 operating companies that went public on US exchanges from 2020 to 2022, 79% are worth less today than their IPO offer price, after adjusting for splits. For a stock in today’s S&P 1500 bought on the same days, the figure is 34%.
The typical loss is not small. The median 2020-22 IPO is 74% below its offer price, while the S&P 500 roughly doubled over the same stretch (median +101% with dividends). One in three is down 90% or more. Only 8% of those with a full price history beat the index from the offer price to today.
Key findings
- Of 694 operating companies that went public on US exchanges from 2020 to 2022, 79.0% traded below their split-adjusted IPO offer price on October 15, 2026 (95% interval 75.8% to 82.0%), against 33.7% of current S&P 1500 stocks bought on the same days (stockanalysis.com IPO lists, Yahoo Finance; SPACs and direct listings excluded).
- The median 2020-2022 IPO was 74% below its offer price in October 2026, and 35% of the 694 were down 90% or more, while the S&P 500 returned a median 101% over the same windows; only 8.1% of 472 IPOs with full price history beat the index.
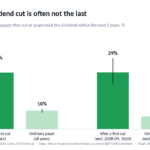
- 65.5% of 2020-2022 IPOs closed their first trading day above the offer price, yet 78.6% of those 309 first-day gainers were below the offer price by October 2026.
- The share of 2020-2022 IPOs below the offer price rose from 39.6% one month after listing to 82.6% after two years and was still 80.1% after four years (472 IPOs).
- 29.4% of 2020-2022 IPOs with full price history (139 of 472) had done a reverse split by October 2026, and all of them traded below the offer price.
- Caveat: the comparison group comes from today’s S&P 1500 members, so stocks that dropped out since 2020 are missing and the true gap is smaller than 45 points; for 222 IPOs, mostly delisted, the last price is not split-adjusted.
Four in five are under water
We started from the full IPO lists for 2020, 2021 and 2022 on stockanalysis.com: 1,694 listings, including companies that have since been bought out, gone bankrupt or left the exchange. We removed 942 SPACs (blank-check shells that list at $10 and later merge with a private company), 8 direct listings (they have a reference price, not an offer price) and 50 listings without an offer price or a last price. That leaves 694 operating companies.
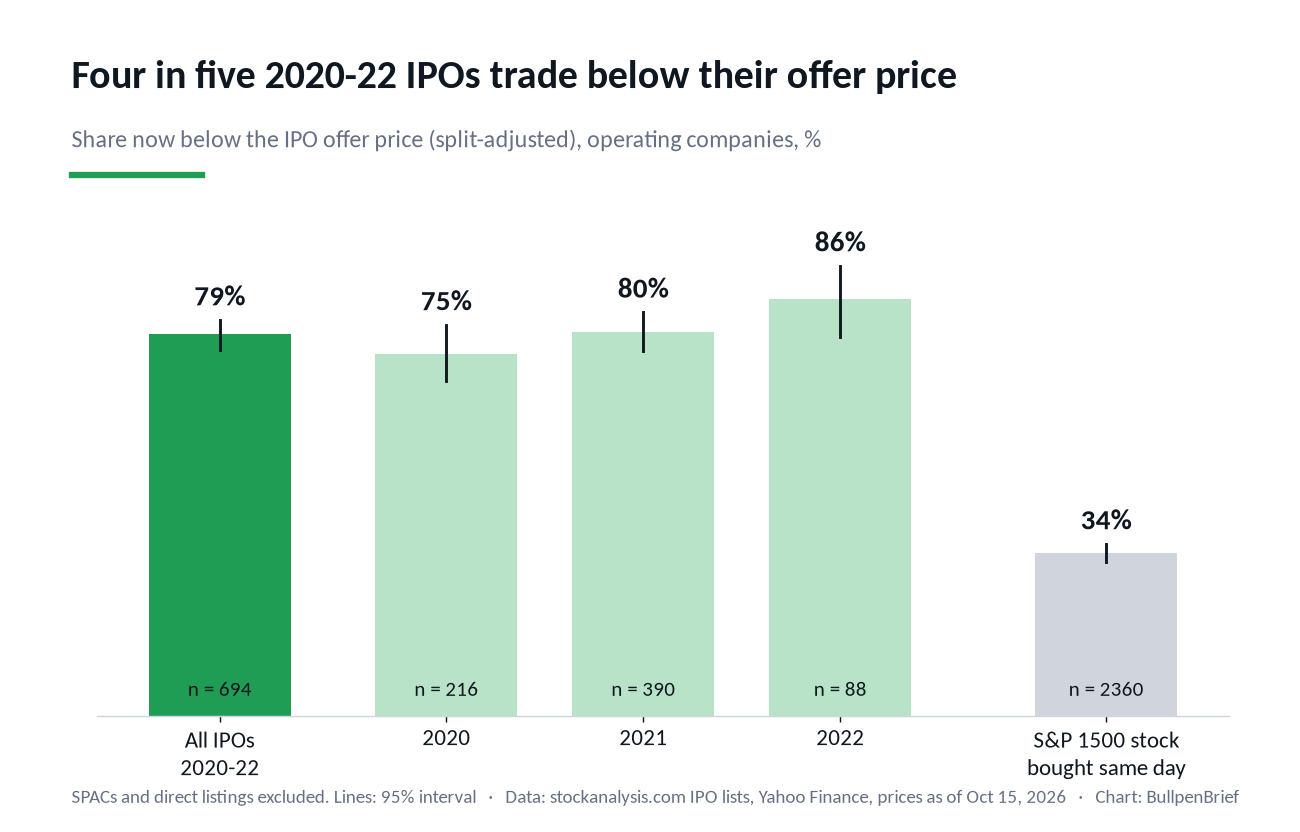
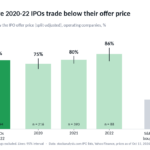
As of October 15, 2026, 548 of the 694 (79.0%, 95% interval 75.8% to 82.0%) are below the price at which their shares were sold in the IPO. The share rises with the year: 75% of 2020 IPOs (216), 80% of 2021 IPOs (390) and 86% of 2022 IPOs (88). The 2022 class went public into a falling market and was far smaller.
The comparison group is ordinary large and mid-sized stocks. For every IPO with a full price history we picked five random stocks from today’s S&P 1500 that were trading on the IPO date and checked whether they are above or below that day’s price now. Of 2,360 such picks, 33.7% (31.8% to 35.6%) are below. The gap with the IPOs is 42 to 49 points.
The losses go deep. 61% of the IPOs are down by half or more, and 35% are down 90% or more. Only 7.6% have doubled. The median return from the offer price is minus 74% (minus 78% to minus 66%).
Day one looked fine
Most of these deals started well. Of 472 IPOs with a full price history, 65.5% closed their first trading day above the offer price, with a median first-day gain of 14.5%. Of the 309 that popped, 78.6% are now below the offer price, against 84% of those that did not pop. A strong debut did not protect anyone.
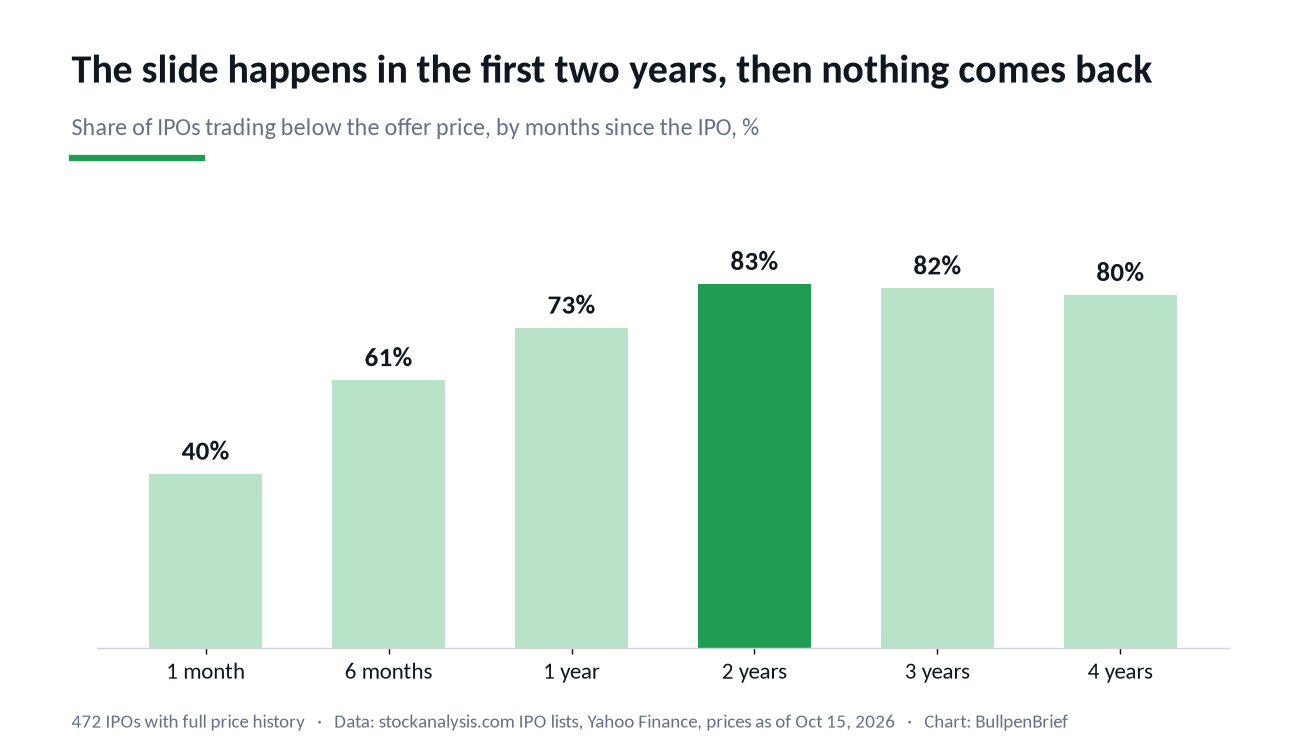
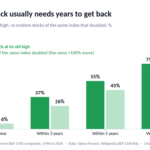
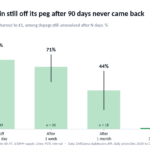
The slide took about two years. One month after the IPO, 39.6% traded below the offer price. After six months it was 60.8%, after a year 72.7% and after two years 82.6%. Then it stopped moving: 81.6% at three years and 80.1% at four. The bull market of 2023 to 2026 lifted the S&P 500 to new highs, but it did not lift this class of IPOs back above water.
Reverse splits tell the same story. 29.4% of the IPOs with a full history (139 of 472) have done at least one, usually to keep the share price above Nasdaq’s $1 minimum. Every one of them is below its offer price. Allbirds (now trading as Smartbird) sold shares at $15 in November 2021; after a 1-for-20 reverse split, the stock at $2.36 is worth 99.2% less than the offer.
Cheap IPOs fared worst, big ones lagged too
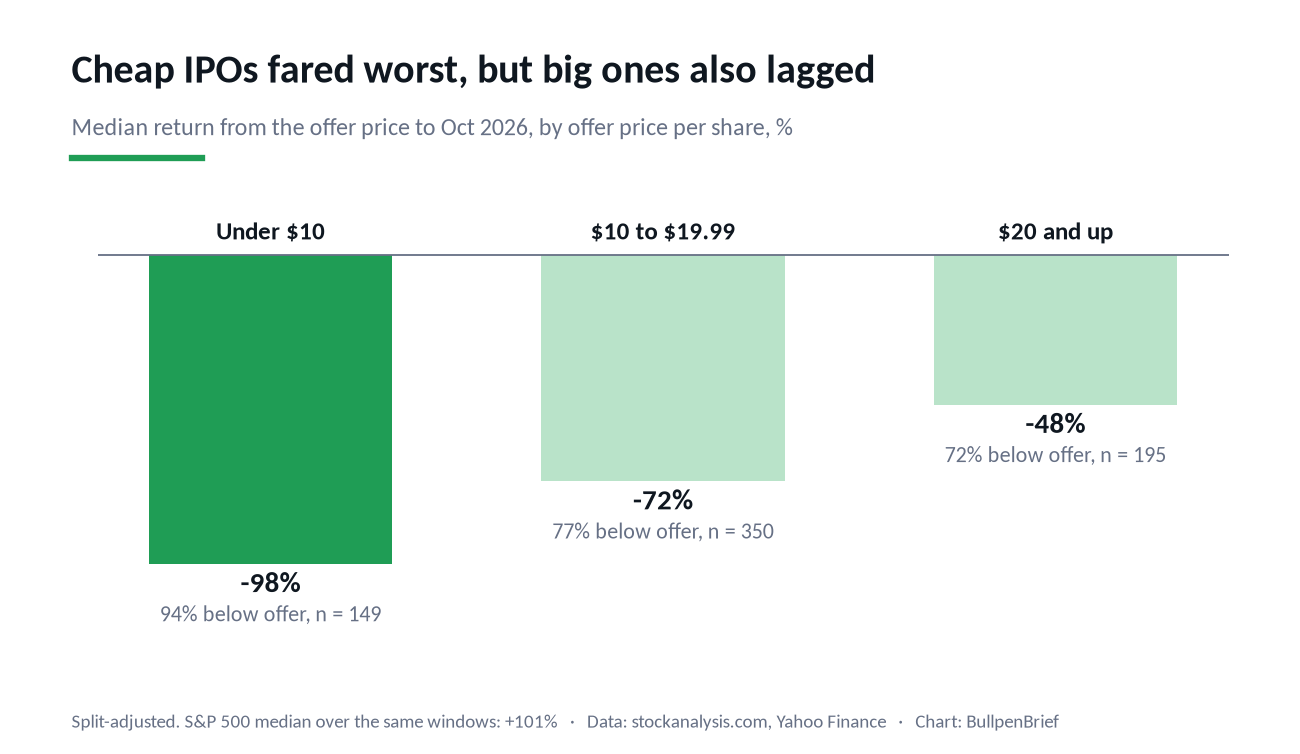
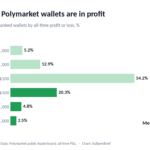
We have no reliable deal size for companies that no longer trade, so we split the sample by offer price per share, a rough sign of how big and established the issuer was. IPOs priced under $10, mostly small Nasdaq listings, did worst: 94% are below the offer and the median is down 98% (149 IPOs). Those priced at $10 to $19.99 are 77% below with a median of minus 72% (350). Even among IPOs priced at $20 or more, 72% are below the offer and the median is down 48% (195).
Well-known names follow the pattern. Rivian (offer $78) is down 83%, Bumble ($43) 86%, Root ($27, split-adjusted) 90%, Toast ($40) 19%, Unity ($52) 17% and Oscar Health ($39) 14%. Li Auto sits almost exactly at its $11.50 offer. The winners are a short list: Snowflake is up 179% from its $120 offer, Robinhood 174%, Airbnb 156%, DigitalOcean 133% and DoorDash 89%.
Companies that left the market
242 of the 694 no longer trade under their IPO ticker. Their last prices are just as weak: 77.7% ended below the offer price. 54 left above it, which usually means a takeover at a premium, and 70 had a last price under $1. Leaving these companies out would change the overall rate very little: 79.6% of the 452 still trading are below the offer.
What this is not
This is not a forecast for IPOs coming to market now. 2020 and 2021 were an unusual peak, with record valuations and record deal counts, and a lot of companies listed that would not have in a normal year.
The offer price is what investors who got an allocation paid. Anyone who bought at the first-day close paid more than the offer in two of three cases, so their results are, if anything, worse than shown here.
The comparison group comes from companies in the S&P 1500 today. Stocks that fell out of the index after 2020 are missing, so the 34% for ordinary stocks is too low, and the true gap with the IPOs is smaller than 45 points. It does not close: the S&P 500 itself is higher today than on any date in 2020 to 2022.
For 222 IPOs, mostly companies that no longer trade, we could not match a price history and used the last price stockanalysis.com records, which is not adjusted for splits. A reverse split before delisting makes that price look higher than it was, so for these companies the share below the offer is, if anything, understated.
Download the data (CSV)
ipos-2020-2022-vs-offer-price.csv: one row per operating-company IPO on a US exchange from January 2020 to December 2022 (694 rows; SPACs and direct listings excluded). Columns: IPO date, ticker, company, offer price, split factor since the IPO, split-adjusted offer price, last price and its date, status (trading or gone), return from the offer price, whether below the offer, first-day return and total return minus SPY. Free to use and cite under CC BY 4.0 with attribution to BullpenBrief and a link to this page.
Methodology
IPO lists come from stockanalysis.com (pages “IPOs in 2020”, “2021” and “2022”, downloaded October 16, 2026): ticker, company, IPO date, offer price per share, last price and listing status, including delisted companies. Split histories and daily prices come from Yahoo Finance, with the SPDR S&P 500 ETF (SPY) as the benchmark. Last prices are closes on October 15, 2026, or the last trading day for companies that no longer trade.
We excluded SPACs (942: names containing “Acquisition”, “Merger” and similar, plus any listing priced at exactly $10 unless we confirmed it was an operating company, 27 of which we kept), direct listings (Palantir, Asana, Roblox, Coinbase, Squarespace, Amplitude, Warby Parker and Thryv) and listings with no offer price or no last price. The offer price is converted to today’s shares using every split after the IPO date. stockanalysis.com does not apply this adjustment; without it, 77.1% of the IPOs would show as below the offer instead of 79.0%. We accepted a Yahoo price history only if it had trades within 10 days of the IPO date at 0.2 to 5 times the offer price, so a reused ticker cannot stand in for the original company. 472 IPOs met that test; the other 222 use the stockanalysis.com last price.
Return from the offer price is the price return. Return against the S&P 500 uses total returns (dividends reinvested) from the first trading day close, scaled to the offer price, against SPY over the same window. The comparison group takes five random stocks per IPO from the 1,367 current S&P 1500 members that traded throughout January 2020 to October 2026 and measures each from the close on or just after the IPO date. Intervals are 95% bootstrap intervals. The largest single gain, Regencell Bioscience (up 3,708%), moves the mean return from minus 29.6% to minus 24.2%; the medians and shares we report do not depend on it. Figures, charts and the method are free to cite with attribution to BullpenBrief.